
NEW
Font size
 Worksheets
Graphs
Total questions: 25
Worksheet time: 2hrs 40mins


How many students take the bus to school?
35
20
10
15
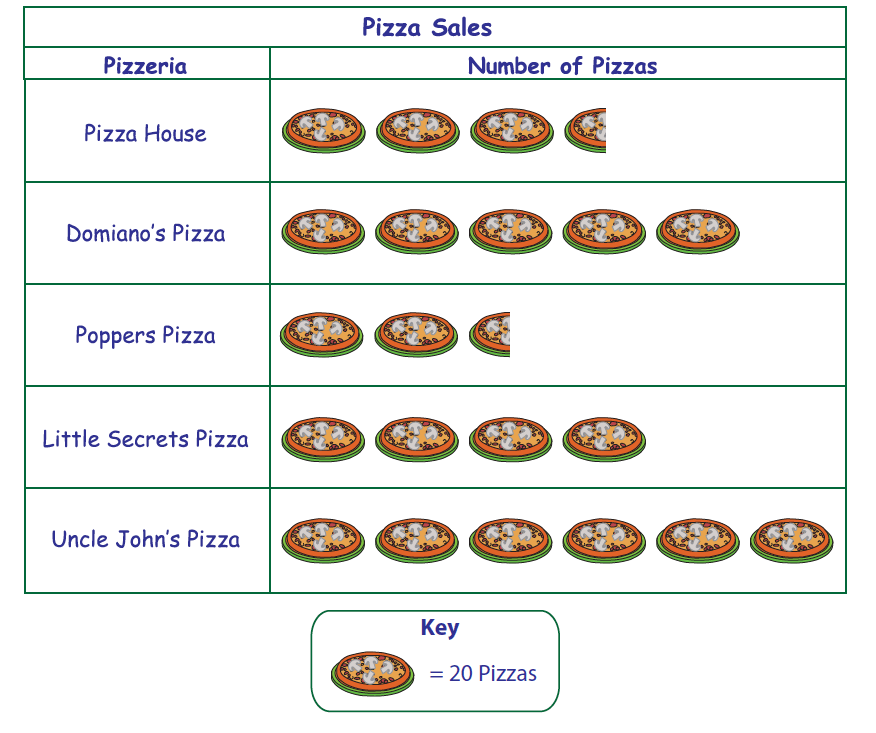
How many pizzas were sold by Poppers Pizza?
50
3
30
2 and a half

How many more runs did Tracy have than Sarah and Patty combined?
6
8
2
1


How many more students liked Chocolate than Mint Chocolate Chip and Strawberry combined?
8
6
14
12

Which bar graph is the same as the data in the circle graph if 20 people were surveyed?


Based on the data in the table, how many students played the three games that had the highest frequency?
62
57
60
61

The stem and leaf plot shows the scores of eight people at a poster making contest. What is the difference between the highest score and the lowest score?
2.9
2.7
29
27

The number of minutes that band members practiced last night are shown in the stem and leaf plot. What is the difference between the least number of minutes a band member practiced and the greatest number of minutes a band member practiced?
51
46
56
61

The scatterplot shows the amount of rainfall during six thunderstorms and the length of time that each storm lasted. Based on the scatterplot, which statement is true?
During each storm that lasted longer than 1 hour, there was less than 1 inch of rain.
During each storm that lasted longer than 1 hour, there was more than 1 inch of rain.
No storms produced more than 2 inches of rain.
No storms lasted longer than 1 hour.

How many more people voted for Garza than Price and Turner combined?
8
26
23
33

The number of teachers at four schools are shown in the bar graph below. The number of teachers at school S is missing. There are a total of 56 teachers at schools S, T and V. Which bar graph represents the number of teachers at school S?



How many people have two or less books in their desk?
4
5
6
7

Which statement below accurately represents the graph?
$100 is earned for each hour worked
$100 is earned for every 2 hours worked
$500 is earned for every 8 hours worked
$200 is earned for every 3 hours worked

How much does it cost to have your lawn mowed for 2 hours?
$16
$17
$18
$19

What is the general trend of this line graph?
The more you mow, the less money you make.
You make the same amount of money regardless of how long you mow.
The more you mow, the more money you make.
Mowing is dangerous.

Do you know a lot about graphs?
Yes
No
Maybe

