
 Worksheets
Chapter 11 Mathematical Modeling
Total questions: 16
Worksheet time: 33mins

What is the bus doing between points A and B?
The bus is speeding up.
The bus's speed is remaining constant.
The bus is stopped.
The bus is beginning to slow down.
What is the bus doing between points C and D?
The bus is speeding up.
The bus's speed is remaining constant.
The bus is stopped.
The bus is beginning to slow down.
The set of input values of a function is called the _______.
domain
function
range
interval
The set of output values of a function is called the ______.
range
domain
function
interval
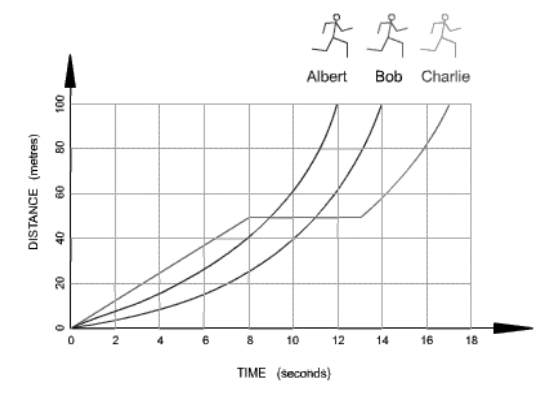
Which runner stopped for a rest?
Albert
Bob
Charlie
No one stopped for a rest.

What type of function does this graph represent?
linear function
quadratic function
exponential function
linear absolute value function
linear piecewise function

What type of function does this graph represent?
linear function
quadratic function
exponential function
linear absolute value function
linear piecewise function

What type of function does this graph represent?
linear function
quadratic function
exponential function
linear absolute value function
linear piecewise function

What type of function does this graph represent?
linear function
quadratic function
exponential function
linear absolute value function
linear piecewise function


What type of function does this graph represent?
linear function
quadratic function
exponential function
linear absolute value function
linear piecewise function

Use the model to predict the estimated weight of the bike for a minimum jump height of 89.7 inches.
17.3 lb
87.6 lb
0.99 lbs
24 lb

Use the model to predict how many pages would be in a book with 19 chapters.
150 pages
170 pages
190 pages
210 pages

Mrs. Collins made a scatterplot to show the relationship between the number of absences and a student’s final exam score. Based on this scatterplot, a student with 6 absences should get approximately what score on the final exam?
65
92
70
76



