
NEW
Font size
S
M
L
XL
 Worksheets
Picture Graphs & Addition Review
Total questions: 20
Worksheet time: 30mins
Name
Class
Date
1.

How many students favorite pet was a cat?
a)
5
b)
10
c)
4
d)
15
2.
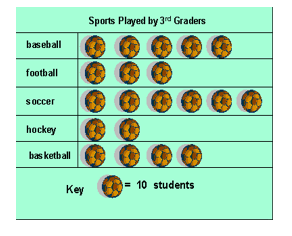
How many students liked basketball?
a)
4
b)
30
c)
40
d)
5
3.

How many more people like the color purple than blue?
a)
1
b)
3
c)
6
d)
8
4.

Which fruit was the most favorite?
a)
Apple
b)
Orange
c)
Graph
d)
Banana
5.

Which lunch choice was the least favorite?
a)
Hot Dog
b)
Pizza
c)
Submarine Sandwich
d)
Hamburger
6.

How many more students liked blue balloons than pink?
a)
1
b)
4
c)
7
d)
3
7.
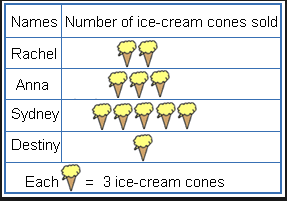
How many cones were sold in all?
a)
16
b)
21
c)
11
d)
33
8.
475 + 324 =
a)
789
b)
799
c)
698
d)
699
9.
658 + 592 =
a)
1260
b)
1250
c)
1150
d)
1110
10.
Estimate the answer:( Round to the nearest hundred)
578 + 720
a)
1300
b)
1200
c)
1290
d)
1298
11.

How many triangles will the Snickers column need? (Look carefully at your symbol and what it represents.)
a)
10
b)
14
c)
2
d)
7
12.

How many cans did Third Grade collect?
a)
4 and a half
b)
27
c)
9
d)
5
13.
724 + 167 =
a)
876
b)
881
c)
863
d)
891
14.
586 + 226=
a)
813
b)
812
c)
821
d)
721
15.
23 + 48 = _______
a)
38
b)
72
c)
71
d)
70
16.
40 + 62 = ________
a)
100
b)
102
c)
22
d)
103
17.
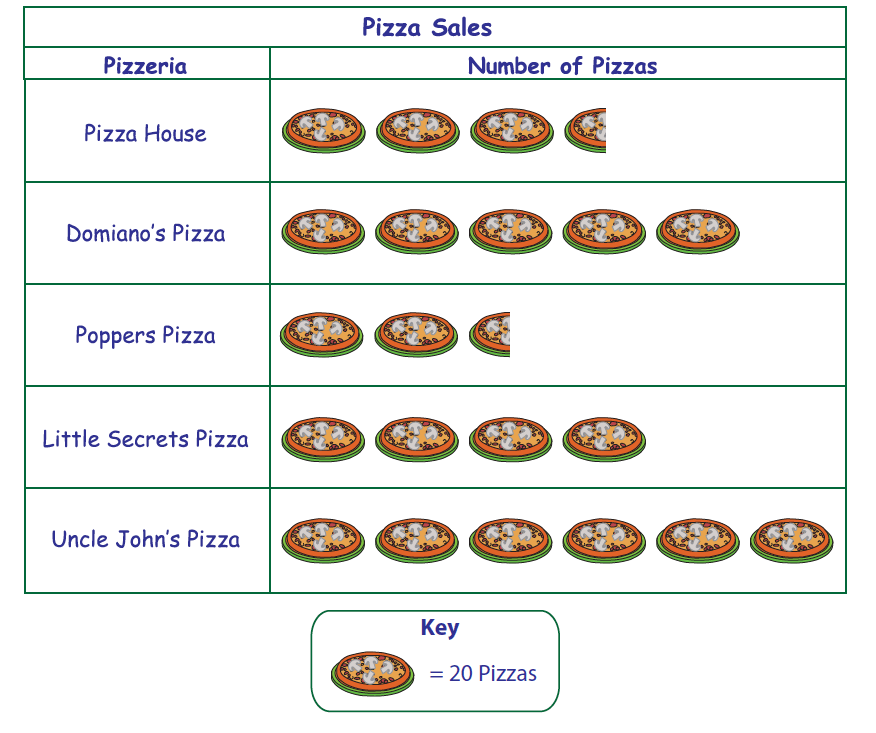
How many pizzas were sold by Poppers Pizza?
a)
50
b)
3
c)
30
d)
2 and a half
18.

How many total votes were collected?
a)
5
b)
10
c)
15
d)
20
19.
364 + 872 =
a)
1126
b)
1246
c)
1136
d)
1236
20.
683 + 954 =
a)
1537
b)
331
c)
1627
d)
1637
Reset

