
Font size
S
M
L
XL
 Worksheets
Data Quiz OL
Total questions: 10
Worksheet time: 50mins
Name
Class
Date
1.

If 200 people were surveyed, approximately how many people like pepperoni and cheese as their topping?
a)
100 people
b)
150 people
c)
50 people
d)
75%
2.

Based on a recent survey of 500 students, the circle graph below shows how students communicate
with friends.
How many more students chose social media apps than phone calls to communicate with friends?
a)
36 students
b)
12 students
c)
180 students
d)
300 students
3.
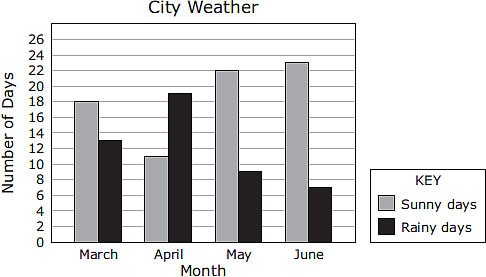
The graph below shows the number of sunny days and rainy days in a city during four months.
Based on the graph,how many more sunny days than rainy days did this city have during the months of April, May, and June?
Based on the graph,how many more sunny days than rainy days did this city have during the months of April, May, and June?
a)
21
b)
56
c)
26
d)
20
4.
What percentage does a whole circle graph represent?
a)
360%
b)
90%
c)
50%
d)
100%
5.

a)
15
b)
20
c)
12
d)
4
6.

What is the median of the data?
a)
105
b)
106
c)
104
d)
110
7.

What is the MODE of this data?
a)
90
b)
85, 90, and 95
c)
85 and 95
d)
None
8.

Which of the following best describes the shape of the distribution?
a)
SKEWED LEFT
b)
SKEWED RIGHT
c)
UNIFORM
d)
SYMMETRICAL
9.

What is the difference between the medians?
a)
16
b)
12
c)
8
d)
4
10.
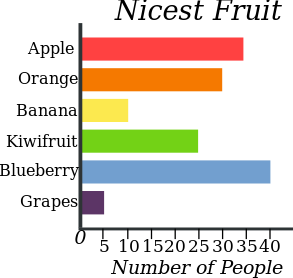
How many fewer people liked bananas than kiwi?
a)
Three fewer people liked bananas than kiwi.
b)
Fifteen fewer people liked bananas than kiwi.
c)
Ten fewer people liked bananas than kiwi.
d)
Twenty fewer people liked bananas than kiwi.
Reset

