wayground logo

Free Printable Worksheets

Font size

S
M
L
XL
Worksheets

Stats - Correlation Coefficient and Line of Best Fit

Total questions: 13

Worksheet time: 25mins

Name
Class
Date
1.

What would be the equation for the line of best fit?

a)

y=3/4x+9

b)

y=-1/2x+9

c)

y=-3/4x-9

d)

y=-3/4x+9

2.

Estimate the correlation coefficient for this scatterplot.

a)

A) r = 1.2

b)

B) r = 0.89

c)

C)r = 0

d)

D) r = -0.89

3.

Describe the relationship between the variables.

a)

A) Weak negative correlation

b)

B) Moderate negative correlation

c)

C) Moderate positive correlation

d)

D) Strong negative correlation

4.

Which colored line is the line of best fit?

a)

A) Black

b)

B) Orange

c)

C) Red

d)

D) Blue

5.

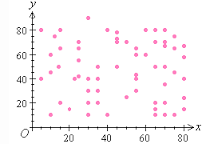
What type of correlation does this graph show?

a)

A) Positive

b)

B) negative

c)

C) none

d)

D) all of the above

6.
Which sentence describes the relationship shown on this scatter plot?
a)
As the temperature decreases, the visitors increase. 
b)
As the temperature increases, the number of visitors increases. 
c)
As the visitors increase, the temperature decreases. 
d)
No correlation
7.

What does the value, r= -0.89, tell us about the linear relationship of two quantitative variables?

a)

Strong positive

b)

Weak positive

c)

Strong negative

d)

Weak negative

8.

Determine the correlation coefficient of the given data:

a)

.9820

b)

-.9643

c)

1.409

d)

.6864

9.
Which equation best represents the data in the table?
a)
y = -13x + 143
b)
y = 13x + 143
c)
y = 143x + 13
d)
y = .996x + .998
10.
What is the correlation coefficient for the data?
a)
1
b)
-1
c)
.9967
d)
.9984
11.
If the correlation coefficient of a table of data is 0.85, what is true about the line of best fit?
a)
There is a weak, positive relationship
b)
There is a strong, positive relationship
c)
There is a weak, negative relationship
d)
There is a strong, negative relationship
12.
Which statement best represents this relationship?
a)
There is no relationship between the number of miles driven and the amount of gas remaining in the tank
b)
As the number of miles driven increases, the amount of gas remaining in the tank increases.
c)
As the number of miles driven increases, the amount of gas remaining in the tank decreases.
d)
A relationship cannot be determined from this scatter plot
13.
What type of correlation (association)?
The outside temperature and the amount of layers you wear. 

a)
Positive correlation
b)
Negative correlation
c)
No correlation