wayground logo

Free Printable Worksheets

NEW

Font size

S
M
L
XL
Worksheets

Scientific Skills- Pre-Assessment

Total questions: 30

Worksheet time: 30mins

Name
Class
Date
1.
The closeness of a measurement to its true value is a measure of its ___.
a)
precision
b)
accuracy
c)
reproducibility
d)
usefulness
2.

Which is the correctly written measurement?

a)

21 ºC

b)

21.1ºC

c)

21.1 ºF

d)

21 ºF

3.

What quantity does this measure?

a)

mass

b)

temperature

c)

volume

d)

density

4.
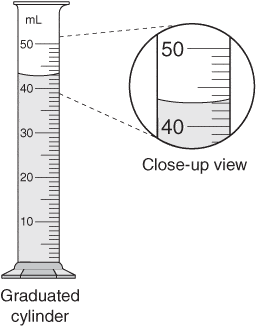
Read this instrument to the nearest milliliter
a)
43 mL
b)
44 mL
c)
43.5 mL
d)
43.0 mL
5.
You are doing an experiment recording the growth of plants under different amounts of sunlight. What is the dependent variable?
a)
The sunlight
b)
The growth
c)
The experiment
d)
The amounts of photons
6.
What is the dependent variable for the hypothesis: If ice melts in salt & fresh water, then it will melt faster in salt water.
a)
The melt time
b)
The amount of salt
c)
The fresh water
d)
The size of the beaker
7.
Which of the following hypotheses is written correctly?
a)
Frozen tennis balls will not bounce as high.
b)
If I heat up a tennis ball it will bounce high.
c)
If I freeze a tennis ball, then it will not bounce as high.
d)
If a tennis ball is frozen, then it won't bounce as high as one that is not frozen.
8.
A testable question is,
"How does the amount of exercise affect heart rate and breathing rate?"
Which is the controlled variable?
a)
amount of exercise
b)
breathing rate
c)
heart rate
d)
temperature of the room
9.
The size of the plant would be the dependent variable for an experiment, for which of the following testable questions?
a)
What light brightness makes plants grow the largest?
b)
Does plant size affect the amount of carbon dioxide that is absorbed?
c)
Which fertilizer makes plants grow the fastest?
d)
Which types of plants will die in mercury-polluted soil?
10.
A biology class of 24 students decides to measure the height of each student and then calculate the average height for the class. Which of these is a possible source of error in this activity?
a)
The number of males and females in the class
b)
The difference in the ages of the students in the class
c)
The total number of students in the class
d)
The accuracy of making and recording measurements
11.
Students use a dissolved oxygen probe during a laboratory activity involving 1,000mL samples of water. The function of the probe is to--
a)
create a model
b)
test a hypothesis
c)
gather data
d)
analyze investigation conditions
12.
A scientist performs an experiment to see if acids have an effect on the health of a particular type of plant. Three sets of plants were treated with acidic solutions of known pH while the control set was treated with a solution of neutral pH 7.Which is the best conclusion for this experiment?
a)
Acid has no effect on the health of this type of plant.
b)
B. High acidity is helpful to this type of plant.
c)
C. Low acidity is harmful to this type of plant.
d)
High acidity is harmful to this type of plant.
13.
The graph below shows atmospheric carbon dioxide levels since the year 1880.Which of the following conclusions can be drawn from this graph
a)
 Atmospheric carbon dioxide levels are responsible for global temperature change.
b)
 Atmospheric carbon dioxide levels have been rising at about the same rate for the past century.
c)
Atmospheric carbon dioxide levels have remained the same over the past century.
d)
 Atmospheric carbon dioxide levels have been rising at an increasingly higher rate as the past century has progressed.
14.
In order to be accepted, a scientific theory must be
a)
 widely tested and supported by extensive data
b)
 based on the results of a single experiment
c)
 controversial and cause debate
d)
 in line with all previous historical ideas
15.
Conclusions based on an experiment are most likely to be accepted when
a)
they are consistent with experimental data and observations
b)
 they are derived from investigations having many experimental variables
c)
 scientists agree that only one hypothesis has been tested
d)
 hypotheses are based on one experimental design
16.
An experiment was carried out to determine whether drinking caffeinated soda increases pulse rate. The pulse rates of two groups of people at rest were measured. Group A was then given caffeinated soda and group B was given caffeine-free soda. One hour after drinking the soda, the pulse rates were measured. The participants in the experiment were all the same age, and they were all given the same amount of soda. The dependent variable in this experiment is the
a)
type of soda given to each group
b)
amount of soda given to each group
c)
 pulse rate of each group
d)
age of participants in each group
17.

What would be the best label for the y-axis of your graph?

a)

Day of Week

b)

Day

c)

Temperature

d)

Temperature (ºF)

18.

What is the general trend of this line graph?

a)

The more you mow, the less money you make.

b)

You make the same amount of money regardless of how long you mow.

c)

The more you mow, the more money you make.

d)

Mowing is dangerous.

19.

Which day saw the greatest difference in temperature

a)

Monday

b)

Tuesday

c)

Wednesday

d)

Thursday

20.
The diagram shows a graduated cylinder containing water.  From which position will the most accurate measure of the volume of water be made?
a)
Position 1
b)
Position 2
c)
Position 3
d)
Position 4
21.
A student conducted an experiment on the dissolving rates of sugar in four different temperatures of water.  What is missing from the figure?
a)
Units of measurement for the water temperature.
b)
Units of measurement for the dissolving rates
c)
Units of measurement for the amount of sugar
d)
Units of measurement for the amount of water
22.
A student conducted an experiment about the movement of a marble through four different liquid substances. Looking at the figure designed by the student, what is an error in his experiment?
a)
The amount of liquid substances used is not consistent.
b)
The type of liquid substances are not labeled correctly.
c)
The type of marble used is not consistent.
d)
The marbles are not dropped from the same distance.
23.
What type of graph would best represent the following data?
a)
Line graph
b)
Bar graph
c)
Circle graph
d)
Pictograph
24.

Using the information in the graph, what is the average speed Josh’s car traveled to get home?

a)

8 km/hour

b)

160 km/hour

c)

16 km/hour

d)

40 km/hour

25.

The temperature in San Jose was 86 on Monday, 83 on Tuesday, and 68 on Wed, What is the Range of the data?

a)

18

b)

22

c)

222

26.

Use the ratio tables to determine how many pencils will be in 8 boxes?

a)

20 pencils

b)

24 pencils

c)

96 pencils

d)

84 pencils

27.
You have left over chemicals after you complete the lab
a)
Follow all instructions given for disposal of chemicals
b)
Place liquids down the drain and solids in the trash
c)
Put left over chemicals back into their original containers
d)
Leave all the chemicals on the lab counter
28.
Reflection
a)
the natural agent that stimulates sight and makes things visible.
b)
The bending of light as it moves from one material to other.
c)
The bouncing of light from a surface.
d)
Some light passing through.
29.
Spectrum
a)
The group of colors that a ray of light can be separates into
b)
A quality such as red, blue, green
c)
A transparent glass that shows color
d)
A curve line of color
30.

A close relationship between two different kinds of organisms, or living things

a)

Metabolism

b)

Symbiosis

c)

Osmosis

d)

Meiosis