
 Worksheets
Scatter Plots TEKS 8.11A & 8.5C
Total questions: 12
Worksheet time: 29mins


What type of association is displayed on the graph?
Negative
no association
positive

What type of association does this scatter plot show?
positive linear association
negative linear association
no association
nonlinear association

Which sentence best supports the relationship shown on this scatter plot?
The more time spent training, the longer it takes to run 100 m.
As the time spent training increases, the time to run 100 m decreases.
As the time spent training decreases, the time to run 100 m decreases.
There is no apparent association between the amount of time spent training and the time it takes to run 100 m.



What conclusion can be made about the relationship shown on this scatter plot?
As the temperature decreases, the visitors increase.
As the temperature increases, the number of visitors increases.
As the visitors increase, the temperature decreases.
No correlation

Molly collected data about the number of hours students studied and their scores on a test. The results are shown in the scatter plot. Which conclusion about the data is true?
As study hours increase, test scores decrease.
As study hours increase, test scores increase.
As study hours increase, test scores stay the same.
As study hours decrease, test scores increase.

Based on the graph, which statement ending would best supports the association?
"As the area of a garden increases, _____________________."
The number of plants decreases.
The number of plants stays the same
The number of plants increases faster.
The number of plants increases.
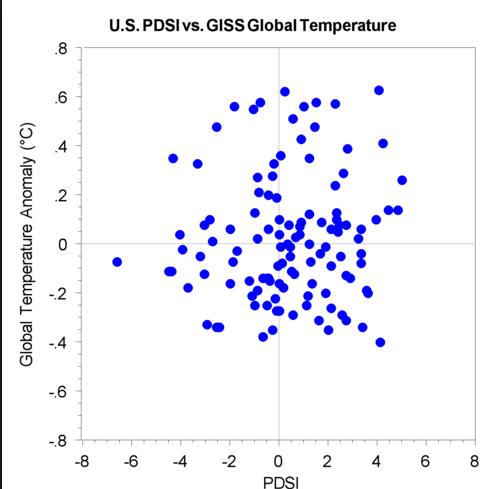
What type of association does this scatter plot represent?
positive association
negative association
no association
Which scatter plot does NOT suggest a linear relationship between x and y?


Julie made 25 international long-distance phone to London last month. The scatter plot below shows the length and cost of each phone call she made.
Which conclusion is best supported by the scatter plot?
As the length of the call increases, the cost of the call increases.
As the length of the call increases, the cost of the call remains the same.
As the length of the call increases, the cost of the call decreases.
There is no relationship between the length of the call and the cost of a call.

