
 Worksheets
Tally Charts and Frequency Tables
Total questions: 20
Worksheet time: 2hrs 40mins
Name
Class
Date
1.

What color car is the least popular at this car dealership?
a)
Red
b)
White
c)
Blue
d)
Green
2.

How many sophomores like burritos and pizza?
a)
6
b)
5
c)
11
d)
50
3.

How many minutes did the most number of people study?
a)
61-90
b)
0-30
c)
31-60
d)
91-120
4.

How many people were polled?
a)
33
b)
6
c)
35
d)
4
5.

What food did the Sophmores eat the least of?
a)
Burrito
b)
Pizza
6.

How many Seniors ate burritos or pizza?
a)
10
b)
5
c)
15
d)
10
7.

How many more blue cars are there than green SUVs?
a)
35
b)
45
c)
25
d)
30
8.

What type of graph is this?
a)
bar graph
b)
pictograph
c)
tally chart
9.

Which fruit did most children choose?
a)
apple
b)
banana
c)
grapes
10.
How do you group tally marks together?
a)
by ones
b)
by twos
c)
by threes
d)
by fives
11.

How many more children chose math than reading?
a)
5 children
b)
2 children
c)
4 children
12.

Katie asked her friends their favorite food. Select the number of tally marks for Hot Dog.
a)
3
b)
4
c)
5
d)
6
13.

Choose the sentence that describes the data in the tally chart.
a)
Pizza had 10 votes.
b)
Pizza got the most votes
14.

How many tally marks?
a)
10
b)
15
c)
3
d)
13
15.

How many tally marks?
a)
9
b)
6
c)
3
d)
7
16.

How many fewer children chose science than math?
a)
2 children
b)
4 children
c)
5 children
17.

Use the picture to answer the following question.
Which subject did the most children choose?
Which subject did the most children choose?
a)
Math
b)
Reading
c)
Science
18.

How many more people chose ladybug than bumblebee?
a)
3
b)
5
c)
4
19.
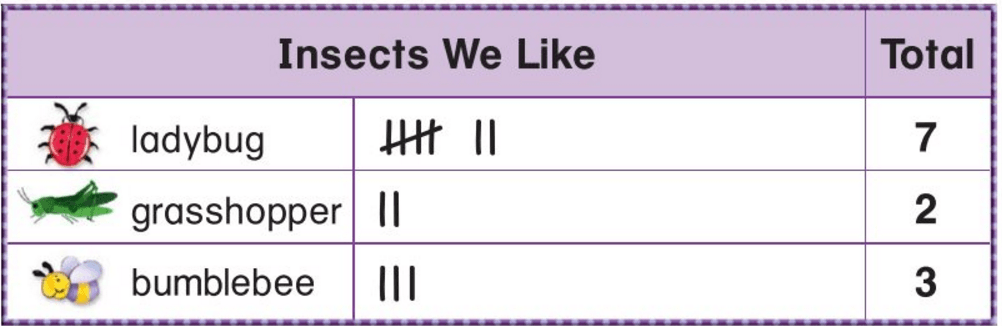
How many fewer people chose grasshopper than bumblebee?
a)
1
b)
2
c)
3
20.

How many individuals prefered goldfish or hamsters?
a)
12 individuals
b)
4 individuals
c)
8 individuals
d)
6 individuals
100 %

