
 Worksheets
Grade 8 - Comparing Diagrams
Total questions: 16
Worksheet time: 1hrs 20mins

Quel enseignant donne le plus de devoirs?
Ms. Smith
Mrs. Williams
Mrs. Brown
Ms. Jones
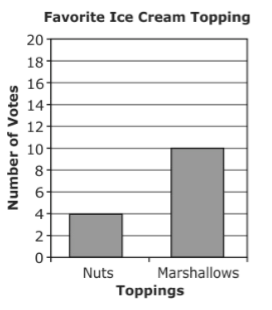
Students voted for their favorite ice cream topping. How many MORE students chose marshmallows than chose nuts?
4
6
10
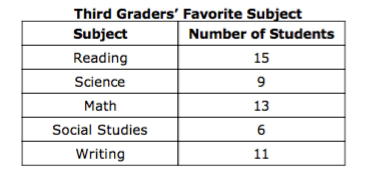
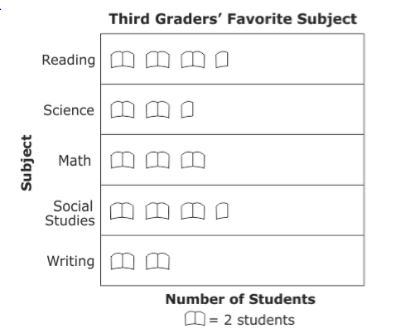
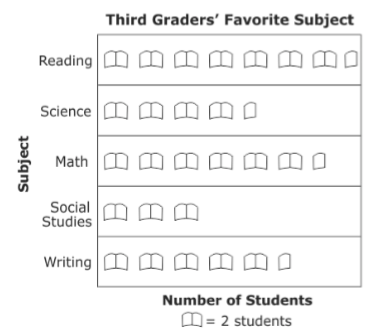
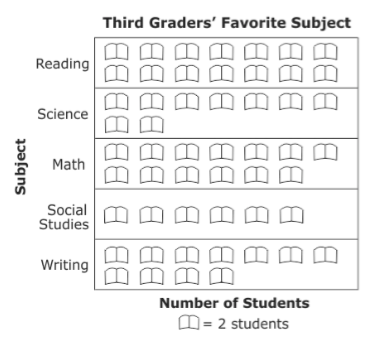
Students in 3rd grade collected data on their favorite subject and recorded it on the table shown. Which graph shows this information?
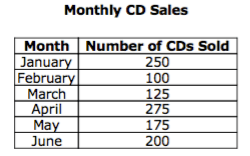
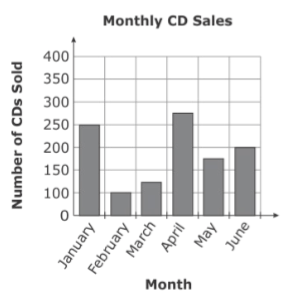
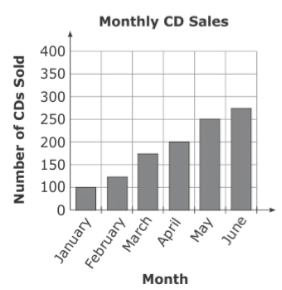
In the chart , a music store listed the number of CDs sold each month for 6 months. Which graph correctly represents the information in the chart?
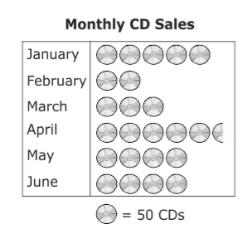
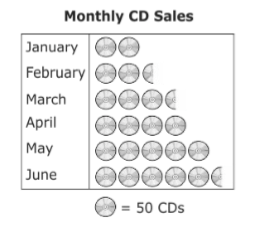

Rita went bird watching. The picture graph below shows the number and types of birds she saw. Which data set was used to make this graph?


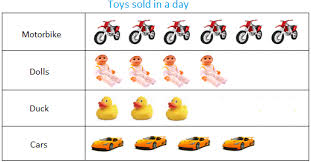
What type of graph is this?
un diagramme circulaire
un pictogramme
un diagramme à bandes

What type of graph is this?
un diagramme à bandes
un pictogramme
un diagramme à ligne brisée

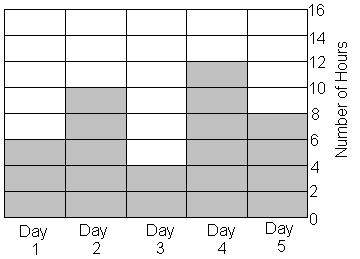
Jamie practiced for her piano recital for 5 days in a row.
What is the sum of hours she practiced on Day 1 and Day 3?
1
2
10
5
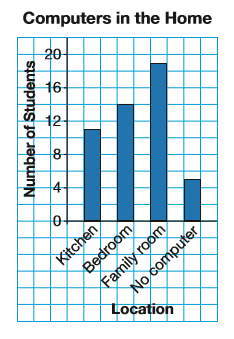
How many students were asked?
48 students
49 students
51 students
52 students

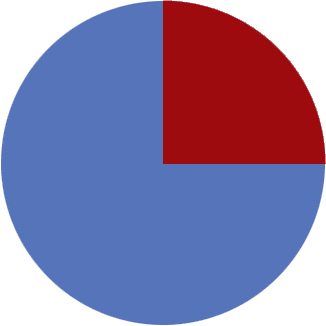
What percent of the graph is red?
50
25
75
360
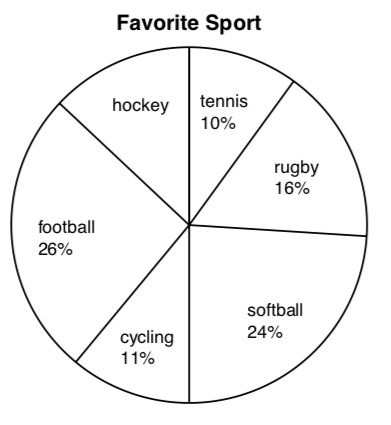
What percent of people chose hockey as their favorite sport?
31 %
25%
50%
13%

What type of graph is shown?
un diagramme à bandes doubles
un diagramme à bandes
un diagramme circulaire

What type of graph is this called?
un diagramme à bandes doubles
un diagramme à bandes
un pictogramme circulaire

