
 Worksheets
Tally Charts
Total questions: 10
Worksheet time: 7mins
Name
Class
Date
1.

What type of graph is this?
a)
bar graph
b)
pictograph
c)
tally chart
2.
Which pet got the most votes?
a)
cats
b)
dogs
c)
fish
3.
How many people like fish best?
a)
10
b)
4
c)
6
d)
5
4.
How do you group tally marks together?
a)
by ones
b)
by twos
c)
by threes
d)
by fives
5.

How many fewer children chose science than math?
a)
2 children
b)
4 children
c)
5 children
6.
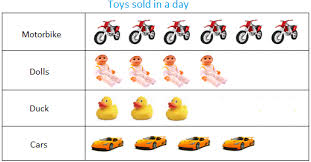
Which toy was sold the most?
a)
motorbikes
b)
dolls
c)
ducks
d)
cars
7.
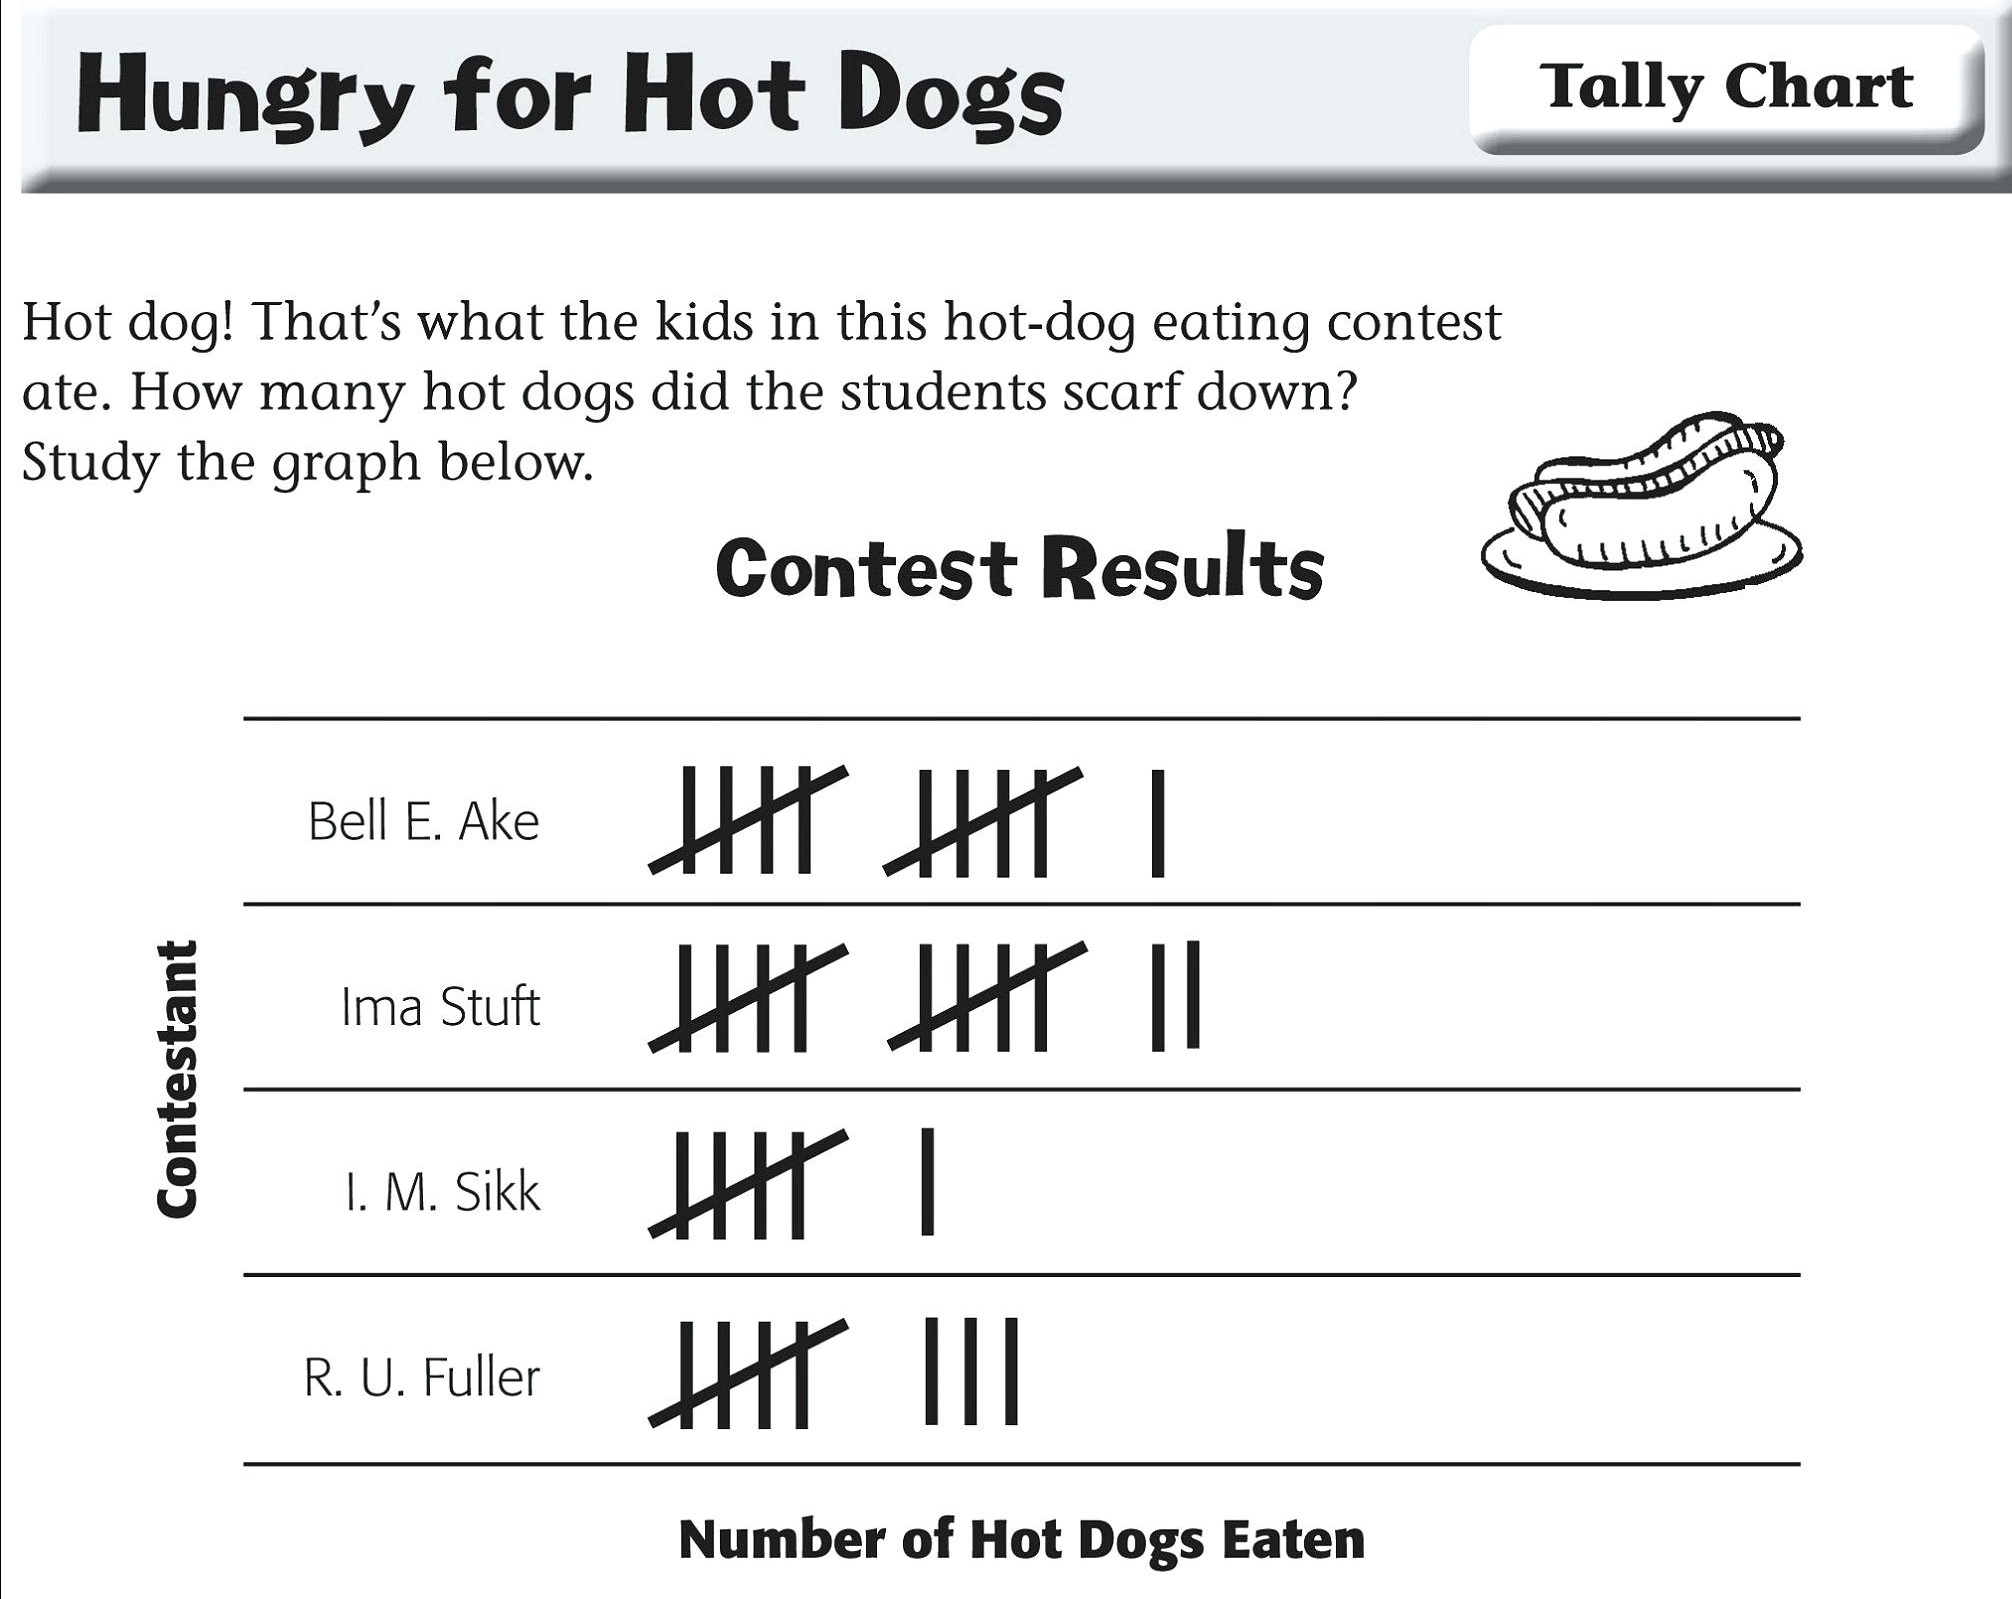
How many hot dogs did Bell E. Ake eat?
a)
11
b)
9
c)
2 1/2
d)
12
8.

How many more did Ima Stuft eat than R.U. Fuller?
a)
1
b)
4
c)
20
d)
3
9.
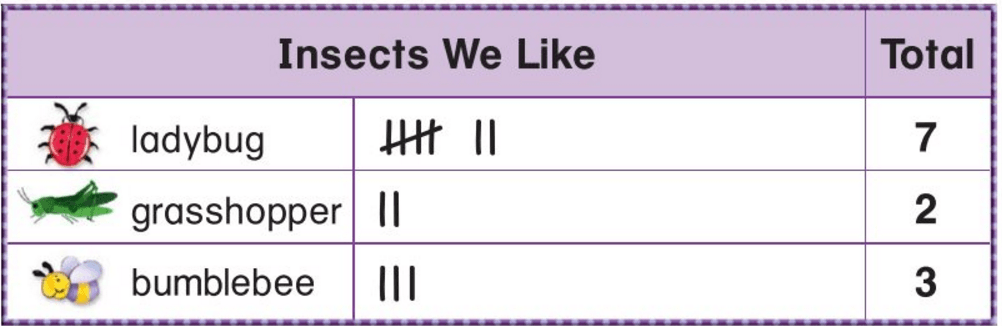
How many fewer people chose grasshopper than bumblebee?
a)
1
b)
2
c)
3
10.
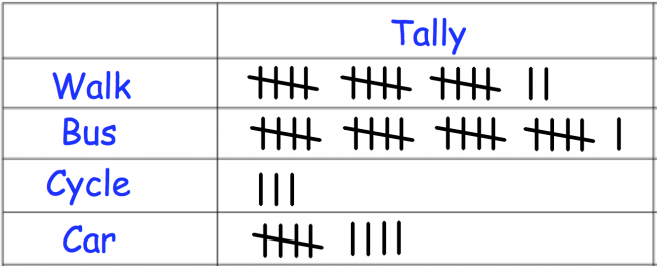
How many people cycle to school?
a)
3
b)
15
c)
4
d)
2
100 %

