
 Worksheets
Test Review 2
Total questions: 43
Worksheet time: 4hrs 0mins
Name
Class
Date
1.
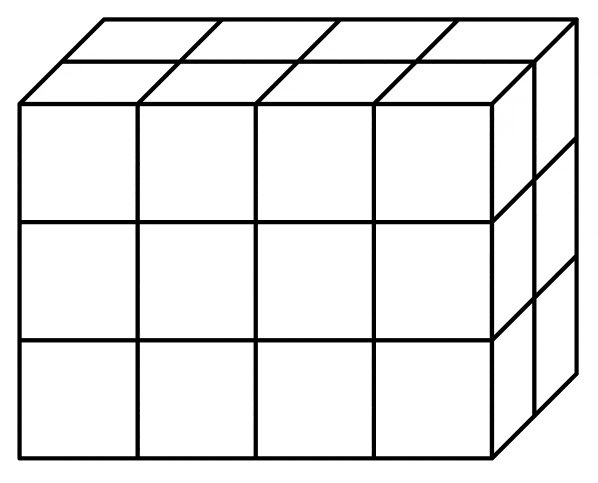
What is the volume of this rectangular prism?
a)
26 cubic units
b)
24 cubic units
c)
24 square units
d)
26 square units
2.
Which formula can be used to find the volume of a rectangular prism?
a)
length x width
b)
length x width x height
c)
height x length
d)
length + width + height
3.
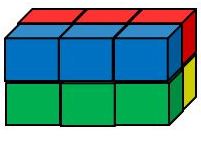
What is the volume of this rectangular prism?
a)
6 cubic units
b)
16 cubic units
c)
12 cubic units
d)
10 cubic units
4.

a)
98 cubic inches
b)
96 cubic inches
c)
76 cubic inches
d)
90 inches
5.

a)
120 cm3
b)
240 cm3
c)
120 cm2
d)
200 cm3
6.
What is the volume of this rectangular prism?
a)
26 cubic units
b)
24 cubic units
c)
24 square units
d)
26 square units
7.
Volume is the amount of space an object takes up.
a)
True
b)
False
8.

What is the volume of this prism?
a)
6 cubic in
b)
12 cubic in
c)
24 cubic in
9.

Find the volume. Show your work.
a)
24 cubic centimeters
b)
60 cubic centimeters
c)
240 cubic centimeters
d)
20 cubic centimeters
10.

When was the greatest amount of shoppers at the store?
a)
10am
b)
1pm
c)
6pm
d)
2pm
11.

How many push-ups were done on Monday?
a)
5
b)
10
c)
15
d)
20
12.

Between which two days was the greatest decrease in push-ups?
a)
Friday and Saturday
b)
Tuesday and Wednesday
c)
Sunday and Monday
d)
Thursday and Friday
13.

What was the bear population in 2001?
a)
40
b)
45
c)
50
d)
55
14.
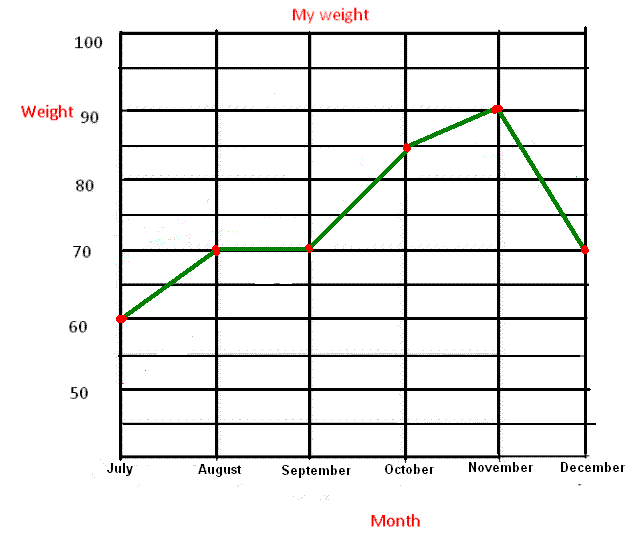
In which month was my weight the highest?
a)
July
b)
September
c)
November
d)
December
15.

Did the temperature increase or decrease between day 1 and day 2?
a)
increase
b)
decrease
16.

What is the name of this graph?
a)
line plot
b)
line graph
c)
bar graph
d)
frequency table
17.

What is the main purpose of a line graph?
a)
to compare two things
b)
to show trends over time
c)
to have an independent variable
d)
so you don't have to read words
18.
Graphs help us represent data
a)
True
b)
False
19.

How many more potatoes were grown in 2011 than in 2009?
a)
5
b)
10
c)
15
d)
20
20.
How many potatoes were grown in 2015?
a)
70
b)
75
c)
50
d)
55
21.

How many boxes of cookies were sold this week?
a)
27
b)
26
c)
28
d)
22
22.
What percentage does a whole circle graph represent?
a)
360%
b)
90%
c)
50%
d)
100%
23.

According to this graph, what is the most popular flavor of Jolly Rancher?
a)
Cherry
b)
Grape
c)
Blue Rasberry
d)
Watermelon
24.

According to this circle graph, what is the least popular flavor of Jolly Rancher?
a)
Blue Rasberry
b)
Watermelon
c)
Grape
d)
Apple
25.

Which circle graph has the same data as the bar graph?
a)
b)
c)
d)
26.
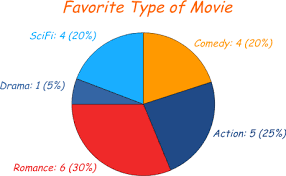
What type of graph is shown?
a)
pictograph
b)
stem and leaf
c)
pie chart
d)
histogram
27.
How many seconds in 4 minutes?
a)
180 seconds
b)
240 seconds
c)
300 seconds
d)
90 seconds
28.
How many minutes in 480 seconds?
a)
9 minutes
b)
8 minutes
c)
7 minutes
d)
10 minutes
29.
How many minutes in 5 hours?
a)
300 minutes
b)
250 minutes
c)
240 minutes
d)
360 minutes
30.
Hour many hours in 600 minutes?
a)
6 hours
b)
10 hours
c)
9 hours
d)
20 hours
31.
How many hours in 3 days?
a)
36
b)
96
c)
72
d)
74
32.
7 hours = ____ minutes
a)
480
b)
360
c)
420
d)
300
33.
3 hours = _____ minutes
a)
150
b)
240
c)
120
d)
180
34.
3 days = ______ hours
a)
72
b)
24
c)
48
d)
36
35.
10 days = _____ hours
a)
96
b)
480
c)
600
d)
240
36.
120 hours = ____ days
a)
5
b)
6
c)
7
d)
8
37.
168 hours = ____ days
a)
5
b)
6
c)
7
d)
8
38.
3 minutes = _____ seconds
a)
720
b)
180
c)
480
d)
360
39.
8 minutes = ____ seconds
a)
480
b)
720
c)
600
d)
240
40.
540 seconds = ___ minutes
a)
10
b)
9
c)
6
d)
7
41.
660 seconds = ____ minutes
a)
11
b)
10
c)
8
d)
9
42.
300 minutes = ___ hours
a)
5
b)
4
c)
3
d)
6
43.
720 minutes = _____ hours
a)
10
b)
11
c)
12
d)
13
100 %

