
NEW
Font size
S
M
L
XL
 Worksheets
Proportional Relationships
Total questions: 40
Worksheet time: 2hrs 11mins
Name
Class
Date
1.

Does this graph represent a proportional relationship?
a)
Yes
b)
No
2.

Does this graph represent a proportional relationship?
a)
Yes
b)
No
3.

What is the unit rate for this graph?
a)
100
b)
25
c)
50
d)
200
4.

Which color car represents a proportional relationship?
a)
Red car
b)
White car
c)
Both cars
d)
None of the cars
5.

Does this table represent a proportional relationship?
a)
Yes
b)
No
6.
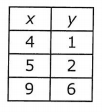
Does this table represent a proportional relationship?
a)
Yes
b)
No
7.

Does this equation represent a proportional relationship?
a)
Yes
b)
No
8.

Does this equation represent a proportional relationship?
a)
Yes
b)
No
9.

The number of trees and the number of apples are given in the table above. Determine which statement below is correct.
a)
The table is not proportional because the unit rate is not constant.
b)
The table is proportional and the unit rate is 1/13
c)
The table is proportional and the unit rate is 13.
d)
The table is not proportional because it doesn't pass through the origin.
10.

Using the graph above, determine the constant of proportionality.
a)
k = 0
b)
k = 1
c)
k = 3
d)
k = 6
11.

Using the table above, determine which statement is correct.
a)
The table is proportional and the unit rate is 100.
b)
The table is not proportional because the unit rate is not constant.
c)
The table is not proportional because it doesn't pass through the origin.
d)
The table is proportional and the unit rate is 0.01.
12.
Determine which equation does NOT represent a proportional relationship.
a)
y = -2x
b)
y = 1/2 x
c)
y = 3x
d)
y = 5x - 7
13.

Using the table above, determine the equation of the line.
a)
y = 5x
b)
y = 10x
c)
y = 1/5 x
d)
y = 1/10 x
14.

The graph above shows the price of games in dollars. Is the graph proportional and how do you know?
a)
The graph is proportional because it is linear.
b)
The graph is proportional because it is linear and passes through the origin.
c)
The graph is not proportional because it does not pass through the origin.
d)
The graph is not proportional because it is not linear and it does not pass through the origin.
15.
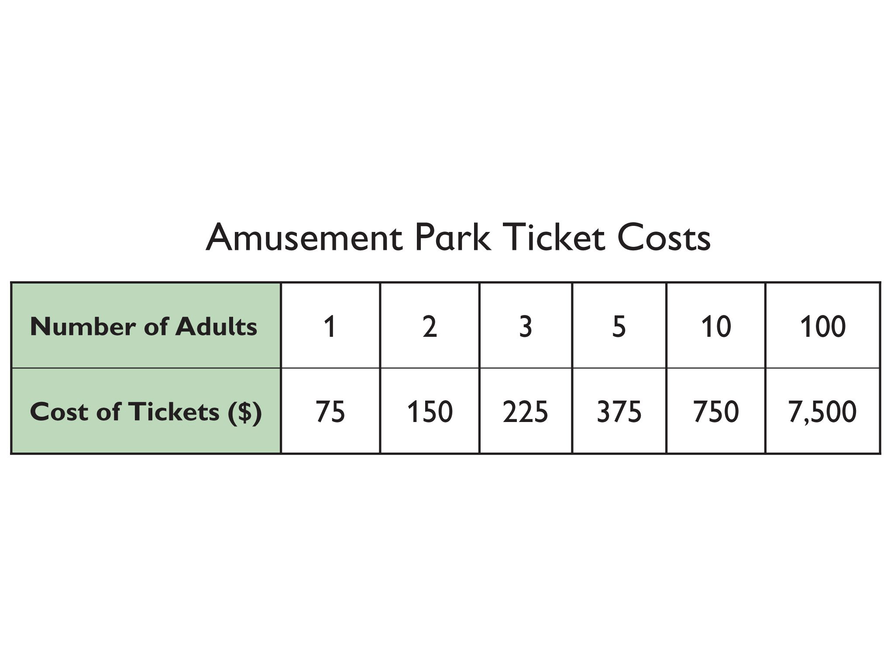
What is the constant of proportionality based on the table above?
a)
1/75
b)
75
c)
1
d)
0
16.

The time in hours, h, it takes to hike in miles, m, is displayed in the graph above. What is the constant of proportionality?
a)
1
b)
2
c)
5/6
d)
6/5
17.

The time in minutes it takes a sloth to move a certain distance in feet is shown in the graph above. How far can a sloth move in 5 minutes?
a)
1 foot
b)
10 feet
c)
20 feet
d)
30 feet
18.

Determine if the table above is proportional and how do you know?
a)
The table is proportional because the unit rate is a constant 0.33.
b)
The table is proportional because it passes through the origin.
c)
The table is proportional because the unit rate is a constant 0.28
d)
The table is not proportional because the unit rate is not constant.
19.

Determine the unit rate from the table above given the distance in leagues, x, and the distance in miles, y.
a)
k = 1/3
b)
k = 3
c)
k = 6
d)
k = 1
20.
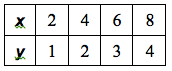
Does the table represent a proportional relationship?
a)
Yes.
b)
No.
21.
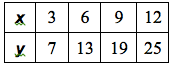
Does the table represent a proportional relationship?
a)
Yes.
b)
No.
22.
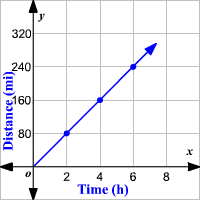
What is the unit rate?
a)
80 miles in 1 hours
b)
20 miles in 1 hours
c)
40 miles in 1 hours
d)
160 miles in 1 hours
23.

Which statement matches the graph?
a)
Taylor can write 6 words per minute
b)
Taylor can write 25 words per minute
c)
Taylor can write 50 words per minute
d)
Taylor can write 150 words per minute
24.
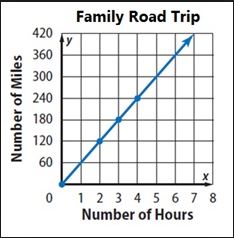
What is the unit rate in this proportional relationship?
a)
60 miles/1 hour
b)
120 miles/ 2 hours
c)
1 mile/ 1 hour
25.

Johnathan saves 25 per month. Who saves more, Miguel or Johnathan?
a)
Johnathan
b)
Miguel
c)
They save the same amount.
26.
What makes a graph proportional?
a)
Straight Line
b)
The line goes through (0,0)
c)
Curvy line
d)
Straight line and passes through (0,0)
27.
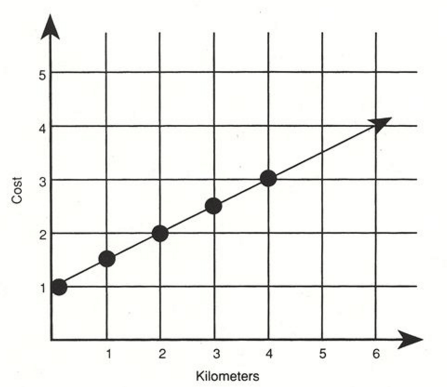
Is the graph proportional or non proportional?
a)
proportional
b)
non proportional
28.
In the equation y = 14x, what is the constant of proportionality?
a)
y
b)
x
c)
14
d)
y=14
29.
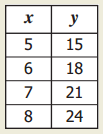
What is the equation y=kx for the table?
a)
y=1/3x
b)
y=3x
c)
y=5x
d)
y=1/5x
30.

Which equation matches the graph?
a)
y = 8x
b)
y = 1x
c)
y = 3x
d)
y = 16x
31.

The equation for the graph is y=2x. Use the equation to find how long it would take the bug on the rug to travel 32 cm.
a)
16 sec
b)
18 sec
c)
64 sec
d)
68 sec
32.
What does k represent in the equation y = kx?
a)
constant for preparation
b)
constant of proportionality
c)
kangaroos
d)
krispy kreme
33.
How do you find k?
a)
x/y
b)
y/x
c)
y=kx
d)
x ⋅ y
34.
In the equation y = 14x, what is the constant of proportionality?
a)
y
b)
x
c)
14
d)
1/14
35.

What does the point (2, 94) represent in this situation?
a)
Every week, they earn $94.
b)
After 94 weeks, they save $2.
c)
After 1 week, they save $47.
d)
After 2 weeks, they save $94.
36.

What does the ordered pair (20, 3000) represent?
a)
The machine folds 3,000 sheets in 20 minutes.
b)
The machine folds 20 sheets in 3,000 minutes.
c)
There are 3,000 sheets in 20 minutes.
d)
There are 20 sheets in 3,000 minutes.
37.

Which statement below accurately represents the graph?
a)
$100 is earned for each hour worked
b)
$200 earned for every 2 hours worked
is the unit rate
is the unit rate
c)
$500 is earned for every 8 hours worked
d)
$300 is earned after working 4 hours
38.
The constant of proportionality can be found by finding the __________ _____________.
a)
unit rate
b)
ratio rate
c)
proportion answer
d)
rational number
39.
Is this equation y = 14x showing proportionality?
a)
yes
b)
no
40.

Write the equation for the table given.
a)
y = 16/2x
b)
y=8x
c)
y=12x
Reset

