
 Worksheets
Do Now: 8/05/20
Total questions: 15
Worksheet time: 23mins


{70, 70, 80, 85, 85, 90, 95, 95, 100, 100}
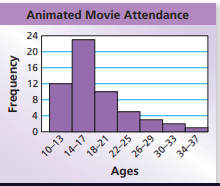
What is the shape of the data?
symmetrical
negatively skewed
positively skewed
unable to determine the skewness

What is the shape of the data?
symmetrical
negatively skewed
positively skewed
unable to determine the skewness

What is shape of the data?
symmetrical
negatively skewed
positively skewed
unable to determine the skewness

What is the shape of the data?
symmetrical
skewed left
skewed right
bell curve
What is the standard deviation for the data given:
5, 10, 7, 12, 0, 20, 15, 22, 8, 2
6.89
10.1
7.26
9
4, 2, 7, 4, 3

The table below shows how 100 people rated a movie from one to five stars. The mean of the data set it:
3
3.5
3.58
4

Consider the table shown. The standard deviation is equal to:
1.17
1.18
1.41
1.58

The parallel box-and-whisker plots show the results of two classes that sat a short quiz with marks out of 10. Which of the following statements is not correct?
The highest score occurred in Class A.
The lowest score occurred in Class B.
Class A and Class B had the same median score.
Class B had a greater interquartile range.

What is the shape of the data?
Positively skewed
Negatively skewed
Symmetric
unable to determine the skewness

What percent of students have a height between 58 inches and 60 inches?
25%
50%
75%
100%

