
NEW
Font size
S
M
L
XL
 Worksheets
Data handling
Total questions: 10
Worksheet time: 5mins
Name
Class
Date
1.

What type of graph is this?
a)
bar graph
b)
pictograph
c)
tally chart
2.
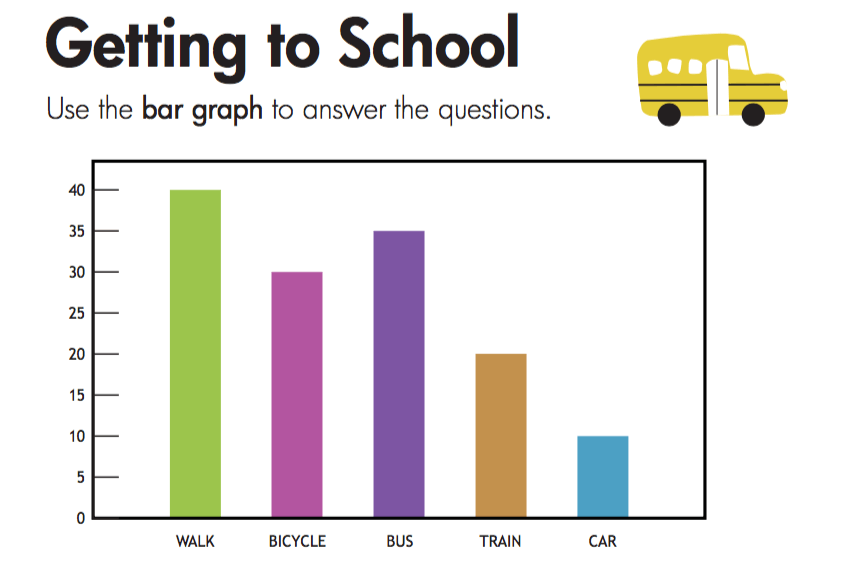
How many students ride their bicycle to school?
a)
40
b)
35
c)
30
d)
20
3.
Representation of Data using rectangles of uniform width and equal spacing between them is called:
a)
Tabular Form
b)
Bar Graph
c)
Pictograph
d)
None of the above
4.
Write 'True' or 'False'
Data obtained in the original form is known as raw data
Data obtained in the original form is known as raw data
a)
TRUE
b)
FALSE
5.

a)
APPLE
b)
BLUE BERRY
c)
ORANGE
d)
KIWIFRUIT
6.

a)
4 MILES
b)
3 MILES
c)
5 MILES
d)
None of the above
7.

a)
10
b)
12
c)
13
d)
14
8.

a)
500
b)
450
c)
400
d)
600
9.
Arranging the numerical figures in an ascending and descending order is called an ____
a)
Data
b)
Table
c)
Pictograph
d)
Array
10.
The bars used to count frequencies are called_____
a)
Tally Marks
b)
Bars
c)
Range
d)
None of the above
Reset

