wayground logo

Free Printable Worksheets

NEW

Font size

S
M
L
XL
Worksheets

Stats

Total questions: 25

Worksheet time: 25mins

Name
Class
Date
1.
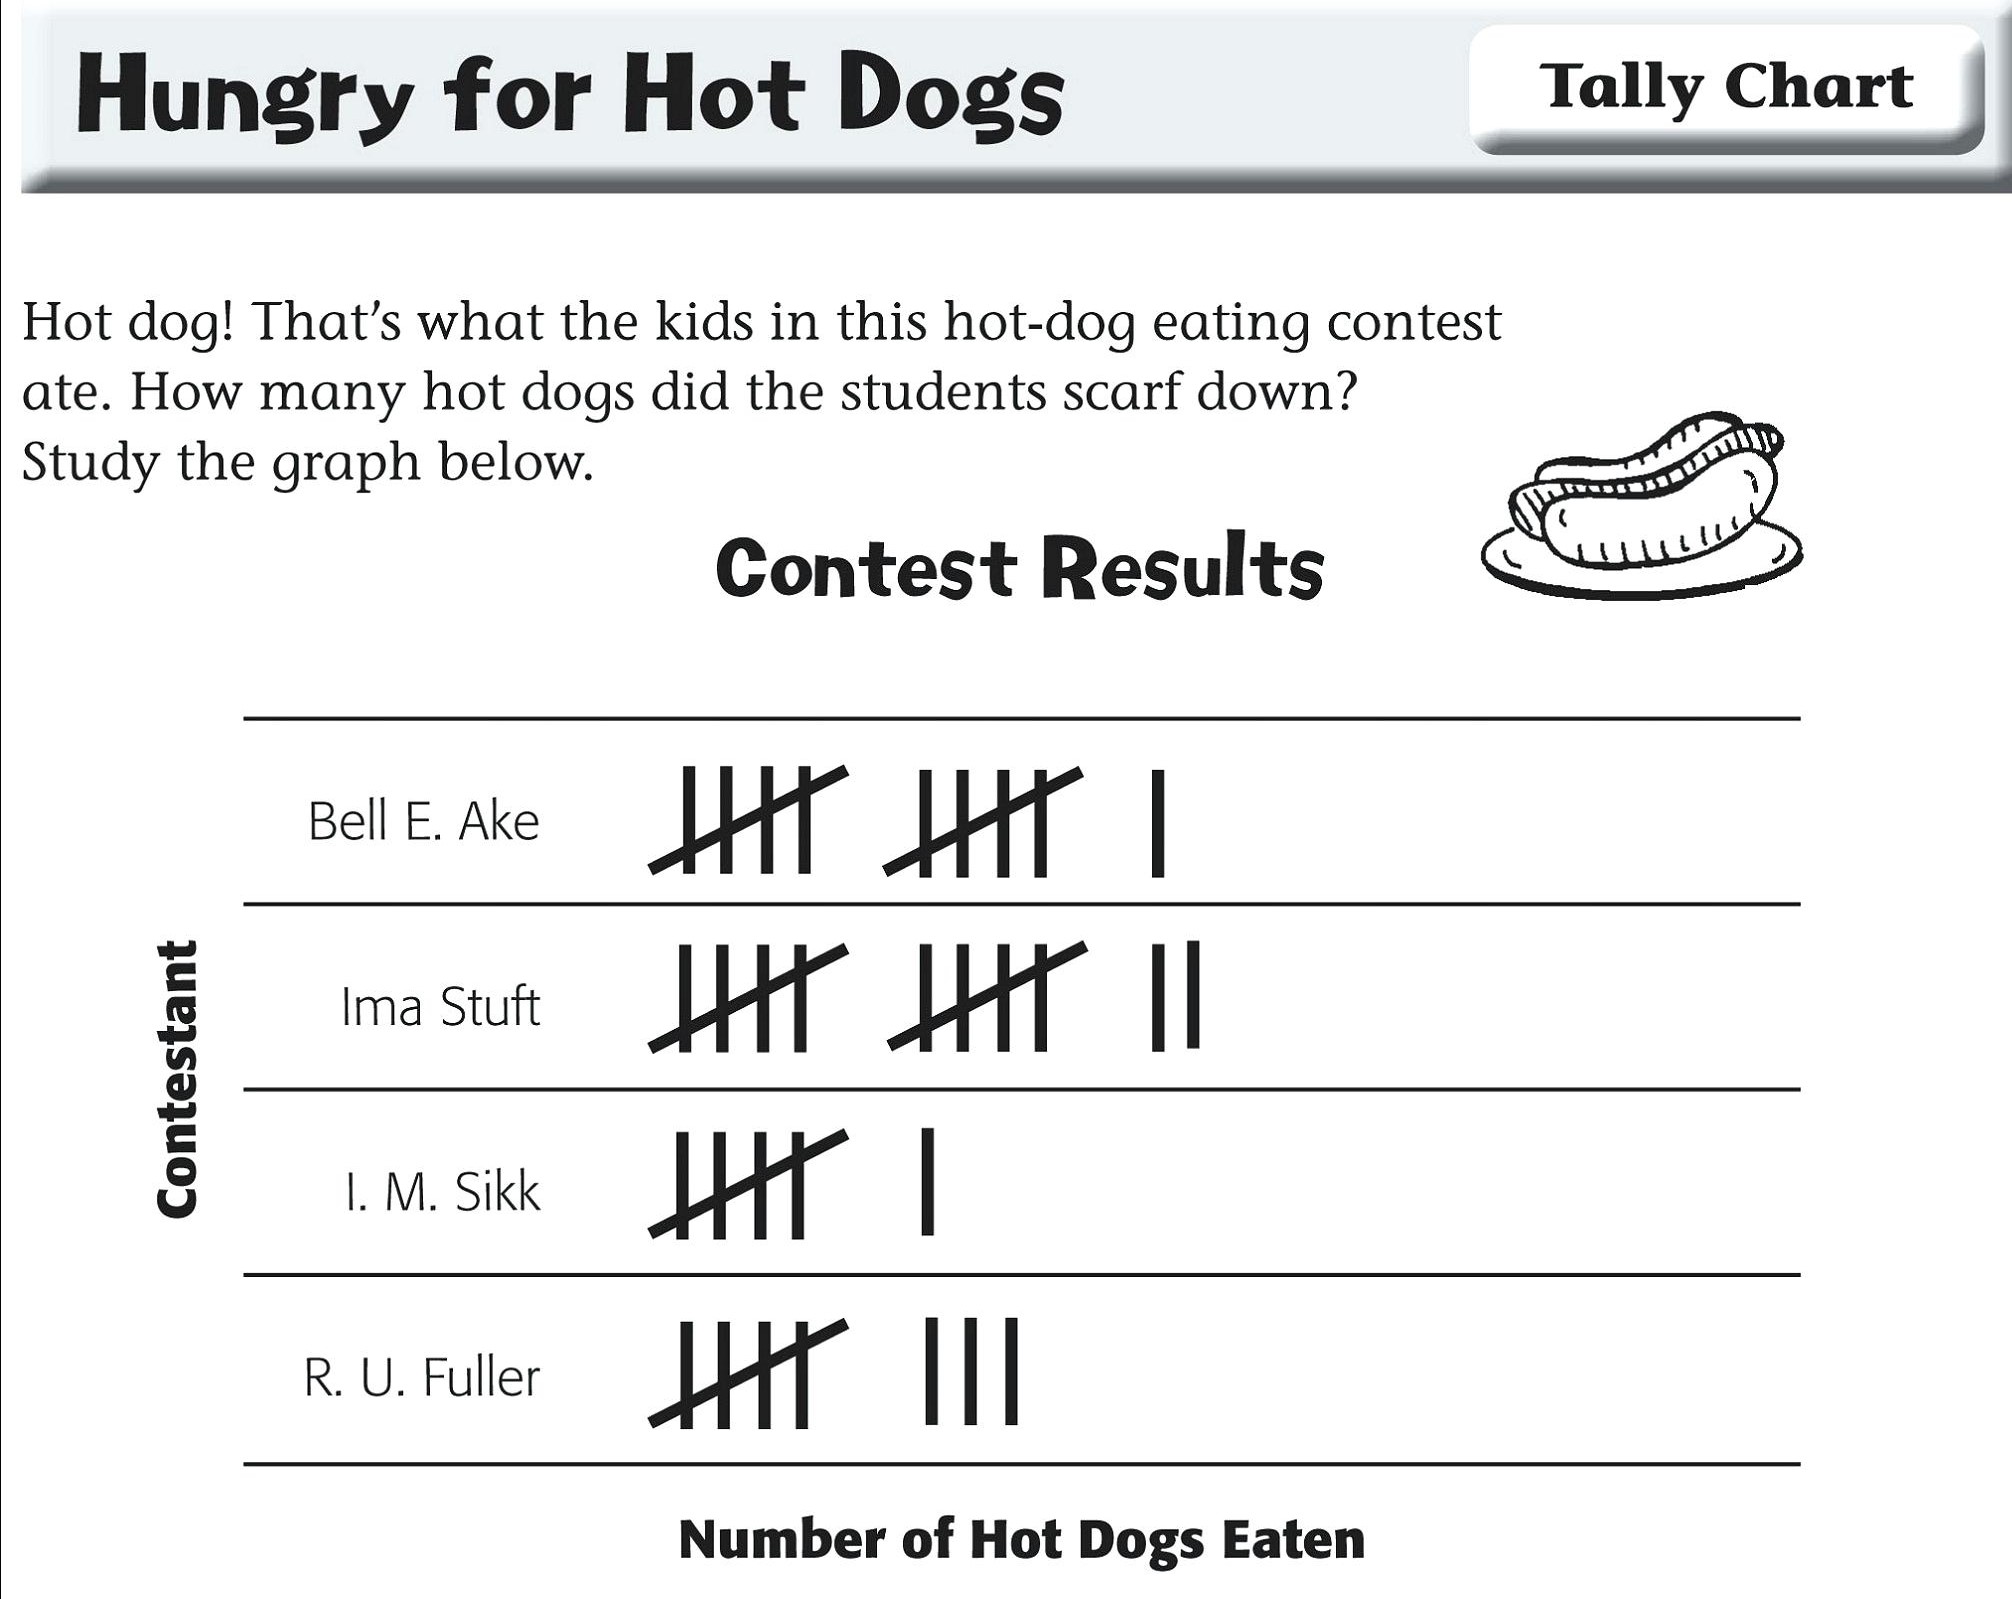
How many tally marks?
a)
4
b)
5
c)
6
d)
1
2.
How many tally marks?
a)
6
b)
7
c)
8
d)
9
3.
What type of graph is this?
a)
bar graph
b)
pictograph
c)
tally chart
4.

All together, how many hot dogs were eaten?

a)

26

b)

40

c)

38

d)

37

5.

How many more flowers were planted on Friday than Sunday?

a)

2

b)

1 1/2

c)

4

d)

3

6.

Based on the data in the table, how many students played the three games that had the highest frequency?

a)

62

b)

57

c)

60

d)

61

7.

Based on the graph, how many more students are in the science club than the book club?

a)

20

b)

16

c)

46

d)

18

8.

The graph shows how employees at Disney World travel to work. How many employees ride bikes, ride the bus, or walk to work?

a)

300

b)

450

c)

325

d)

375

9.

The bar graph shows data about the pets owned by math students in four classes. One bar is missing from the graph. If the students have a total of 32 dogs, which bar shows the number of dogs Ms. Davalos's class has?

a)
b)
c)
d)
10.

What type of graph is shown?

a)

line graph

b)

line plot

c)

stem and leaf

d)

bar graph

11.

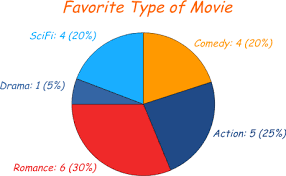
What type of graph is shown?

a)

pictograph

b)

stem and leaf

c)

pie chart

d)

histogram

12.
What is the mean?
a)
# happening the most
b)
the number in the middle
c)
biggest-smallest
d)
the average
13.
What is the range of the dot plot?
a)
9
b)
5
c)
4
d)
6
14.

What is the median of the following data set?

25, 42, 36, 12, 19

a)

36

b)

25

c)

39

d)

26.5

15.
How many students spent over 40 minutes but under 60 minutes studying?
a)
22 Students
b)
30 Students
c)
8 Students
d)
5 Students
16.
Find the mean of the numbers:
2, 4, 5, 5, 6, 8
a)
5
b)
4
c)
3
d)
2
17.
What is the Range of the following data:6, 8, 12, 3, 25, 13, 29
a)
2
b)
26
c)
27
d)
29
18.
Calculate the range of the following:
2, 5, 8, 3, 13, 5
a)
11
b)
13
c)
5
d)
8
19.
Another word for average is
a)
sample 
b)
mean
c)
data
d)
numerical data
20.
What is the mode of the data?
a)
1 book
b)
9 books
c)
3 books
d)
0 books
21.
To find the ______ you put all numbers in order from least to greatest and then take the largest number minus the smallest number.
a)
Mean
b)
Median
c)
Mode
d)
Range
22.
Find the median of these numbers:
2, 3, 4, 5, 5, 7
a)
4
b)
5
c)
4.5
d)
6
23.
Which interval shows the greatest number of pets?
a)
15-19
b)
0-4
c)
5-9
d)
10-14
24.
What was the day with the least amount of cars sold? 
a)
Monday
b)
Tuesday
c)
Wednesday
d)
Thursday
25.

What is the mode of the following data set?

5, 7, 7, 8, 12 , 12, 5, 6, 13, 12

a)

5

b)

7

c)

12

d)

no mode