wayground logo

Free Printable Worksheets

NEW

Font size

S
M
L
XL
Worksheets

Term 3 Week 4 Skills Task

Total questions: 20

Worksheet time: 36mins
Name
Class
Date
1.

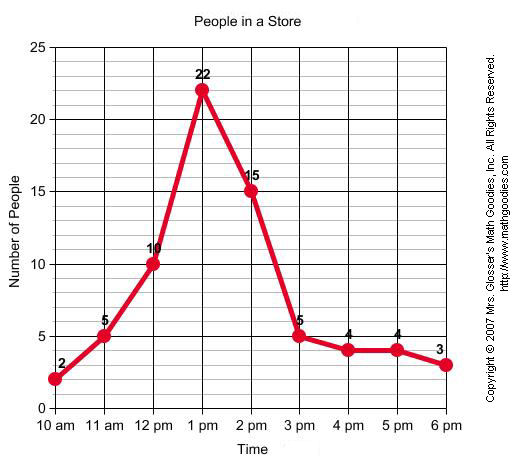
Between which two times was the greatest increase in number of shoppers?

a)

12pm and 1pm

b)

1pm and 2pm

c)

2pm and 3pm

d)

10am and 11am

2.
What was the bear population in 2001?
a)
40
b)
45
c)
50
d)
55
3.
Between which two years did the bear population remain constant?
a)
2004 and 2005
b)
2001 and 2002
c)
2005 and 2006
d)
2000 and 2001
4.
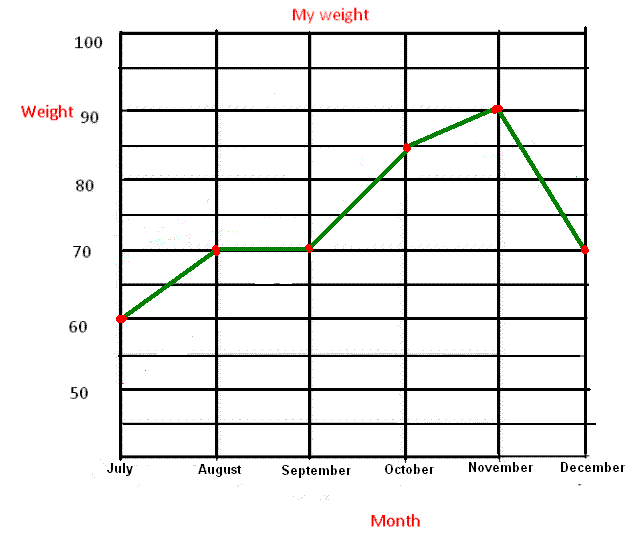
In which month was my weight the highest?
a)
July
b)
September
c)
November
d)
December
5.

A ____________ shows the overall trend of all the data taken in an experiment.

a)

line of best fit

b)

slope

c)

position

d)

direction

6.

Which type of graph best represents data over a set period of time?

a)

line

b)

bar

c)

table

d)

circle

7.

What is this graph showing?

a)

How the mass of the dog changed

b)

How much food the dog consumed

c)

what kinds of food the dog consumed

d)

When the dog was measured each month

8.

At what rate did the temperature decrease between the 20th and 25th minutes of the experiment?

a)

10°C in 5 min

b)

10°C in 10 min

c)

5°C in 5 min

d)

5°C in 10 min

9.

A restaurant recorded the number of pizzas sold each month for one year. The data are shown in the graph below. During which month did the restaurant sell 40 pizzas?

a)

March

b)

May

c)

July

d)

August

10.

Which month had the biggest difference between the high and low temperatures?

a)

January

b)

April

c)

October

d)

November

11.

The graph shows the number of inches a plant grew each week.

Between which 2 weeks did the plant grow the MOST?

a)

Week 1 and Week 2

b)

Week 2 and Week 3

c)

Week 3 and Week 4

d)

Week 4 and Week 5

12.
Data Table
a)
 organizes data into rows and columns.
b)
data that is irrelevant to what is being tested or observed.
c)
a series of steps used by scientists/people to help find solutions to problems and/or questions.
d)
A graph used to display data over time.
13.
Conclusion
a)
Review and interpret information. Examine carefully
b)
Summarizes the important parts of an experiment and discusses what the data, patterns, and relationships mean.
c)
A numbered, step-by-step set of directions written to conduct an investigation and to identify what data will be collected.
d)
Organizes data into rows and columns.
14.
Matt wants to test which liquid freezes first: Pepsi, milk, or apple juice.  He poured 50 mL of each into separate glasses and placed them in his freezer.  Every ten minutes, he checked his freezer and recorded his observations.  Pepsi froze first, followed by apple juice and then milk.  What is his dependent variable?
a)
type of liquid
b)
length of time until frozen
c)
amount of liquid
d)
location of freezer
15.
Betty wants to test which type of phone has the longest battery life.  She is comparing iPhone 6 Plus, Samsung S5,  and a Droid.  She bought each phone new and charged them completely to 100%.  Then, she turned each phone on and timed how long until the battery ran out.  What is the independent variable in her experiment?
a)
brand of phone
b)
time until battery ran out
c)
time it took to charge to 100%
d)
outlet used for charging
16.
Kira wants to test which type of soda creates the biggest foam explosion when adding a Mentos candy.  She chose Sprite, Coke, and Mountain Dew.  One at a time, she added a single Mentos candy and measured the height of the foam eruption.  Mountain Dew created a foam eruption of 7 inches.  Coke and Sprite tied at 5 inches.  What is her dependent variable?
a)
Brand of soda
b)
number of mentos candies used
c)
height of foam eruption
d)
temperature of soda
17.
Which of the following is a quantitative observation?
a)
The bird is very colorful.
b)
The bird has 4 different colors on him.
c)
The bird has many, many feathers.
d)
It is a bird. 
18.
Susan gathers information about her question by making observations of different types of grasses, this will help her write her hypothesis. She is_____.
a)
Conducting Research
b)
Conducting An Experiment
c)
Asking A Question
d)
Making a Conclusion
19.
In which step of the scientific method would you make a graph or review your data?
a)
Hypothesis
b)
Experiment
c)
Research
d)
Analysis
20.
What happens in the step "hypothesis"?
a)
 A scientist conducts an experiment
b)
A scientist creates a graph
c)
A scientists makes a prediction 
d)
 A scientist asks a question