
 Worksheets
Unit 1 Review - Graphs
Total questions: 27
Worksheet time: 1hrs 3mins
Name
Class
Date
1.

Each dot represents 1 day. How many days were recorded?
a)
9
b)
21
c)
20
d)
105
2.

How many students read no books (zero) last summer?
a)
6
b)
1
c)
4
d)
3
3.

How many students have a shoe size bigger than 8?
a)
2
b)
3
c)
4
d)
9
4.

How many students' favorite color is blue?
a)
11
b)
12
c)
14
d)
17
5.

How many more people like purple than red?
a)
3
b)
5
c)
7
d)
9
6.

Mary is recording her plant's growth in a journal. How many inches has the plant grown from week 1 to 7?
a)
22
b)
18
c)
14
7.

Which interval has 400 employees?
a)
33-43
b)
0-10
c)
77-87
d)
66-76
8.

How many students scored between a 86 and a 90?
a)
1
b)
3
c)
6
d)
10
9.

Which interval contained the fewest scores?
a)
0-9
b)
50-59
c)
both 0-9 and 50-59
d)
10-19
10.

What type of graph is this?
a)
Bar Graph
b)
Histogram
c)
Line Plot
11.

What type of association does this graph have?
a)
positive
b)
negative
c)
none
d)
all of the above
12.

As the age of the car increases, its value decreases. Which scatterplot represents this relationship?
a)
A
b)
B
c)
C
d)
D
13.

a)
As the age of the car increases, the asking price increases.
b)
As the age of the car increases, the asking price decreases.
c)
The age of the car does not affect the asking price.
d)
The asking price consistently decreased by $10,000 per year.
14.
Calculate 25% of 80
a)
20
b)
80
c)
48
d)
95
15.

The team scored 50 points. How many points did Kendrick score?
a)
12 points
b)
20 points
c)
10 points
d)
72 points
16.

According to this circle graph, what is the least popular flavor of Jolly Rancher?
a)
Blue Rasberry
b)
Watermelon
c)
Grape
d)
Apple
17.
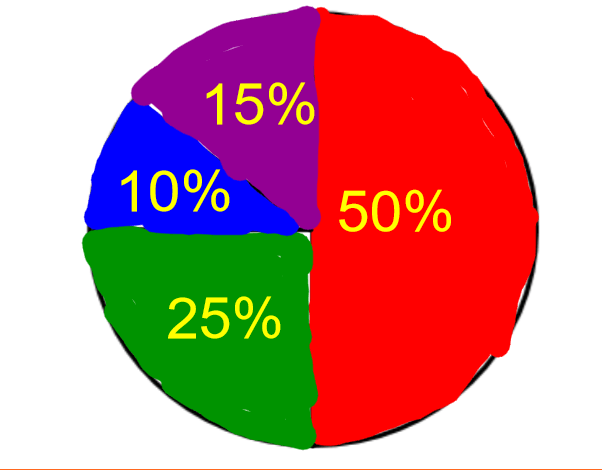
90 people were surveyed. How many liked red?
a)
50
b)
45
c)
30
d)
25
18.

How many students scored more than 80%?
a)
10
b)
13
c)
7
d)
15
19.

How many students got a perfect score on the test?
a)
0
b)
2
c)
6
d)
1
20.

How many scores are listed in this Stem and Leaf Plot?
a)
3
b)
6
c)
9
d)
18
21.

In how many games did the team score more than 20 points?
a)
8
b)
7
c)
10
d)
9
22.

What is the general trend of this line graph?
a)
The more you mow, the less money you make.
b)
You make the same amount of money regardless of how long you mow.
c)
The more you mow, the more money you make.
d)
Mowing is dangerous.
23.

What is the total number of students surveyed?
a)
52
b)
54
c)
56
d)
20
24.

About how many male math teachers were there in 2006?
a)
15
b)
30
c)
35
d)
45
25.

How many students were greater than or equal to 60 inches tall?
a)
21
b)
11
c)
17
d)
6
26.

How many bags of candy had between 30 and 40 orange candies?
a)
6
b)
10
c)
7
d)
8
27.

How many baseballs were thrown 50 or more feet?
a)
5
b)
4
c)
13
d)
8
100 %

