
Font size
 Worksheets
1.1 - 1.3
Total questions: 12
Worksheet time: 11mins

The map above illustrates
a Robinson projection map.
a contour map.
a Mercator projection map.
a Peters projection map.

The map above represents what kind of map projection?
A homolosine projection with continuity of landmasses
A gnomic projection with distortions of bodies of water
A Robinson projection with distortions at the equator
A Mercator projection with distorted land areas
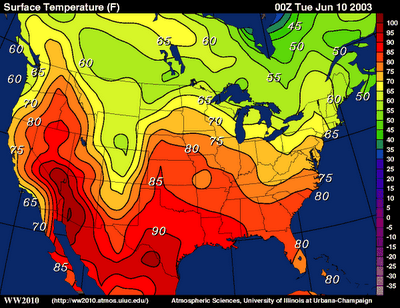
Which type of map is this?
Isoline
Chloropleth
Proportional Symbol
Dot
Cartogram
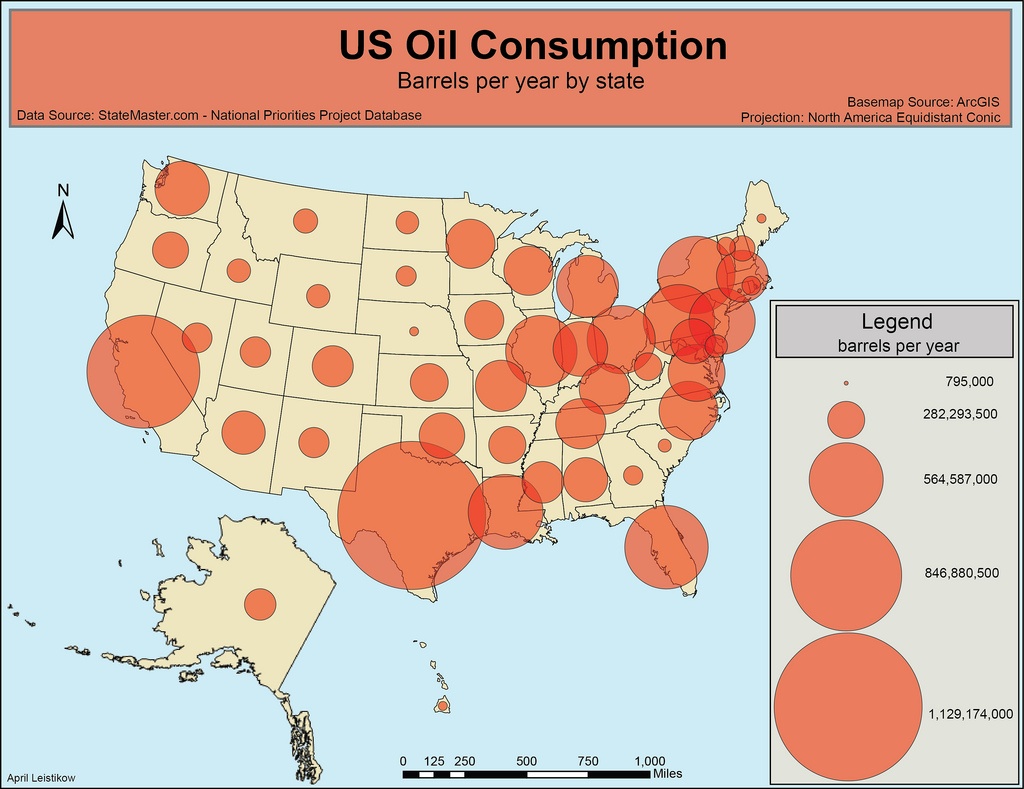
Which type of map is this?
Isoline
Chloropleth
Proportional Symbol
Dot
Cartogram
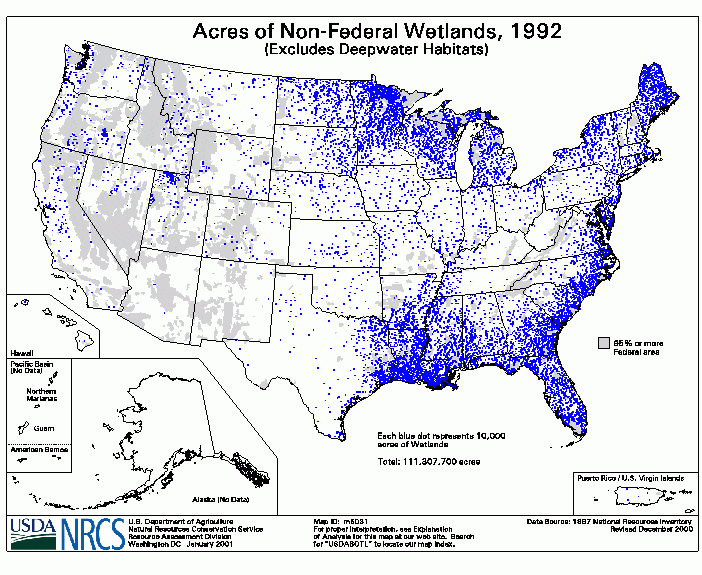
Which type of map is this?
Isoline
Chloropleth
Proportional Symbol
Dot
Cartogram
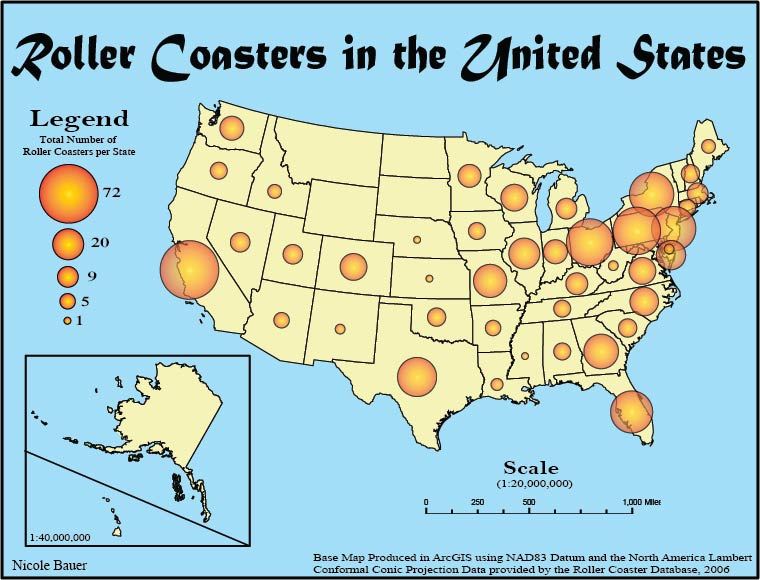
According to this proportional symbol map, which state has more roller coasters?
Florida
Texas
California
Illinois
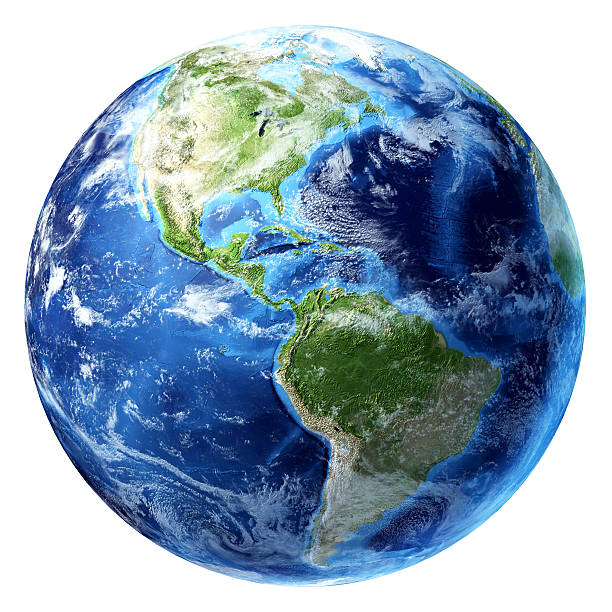
Riddle! What travels around the world but stays in the corner?
Compass
Stamp
Baby
Boat
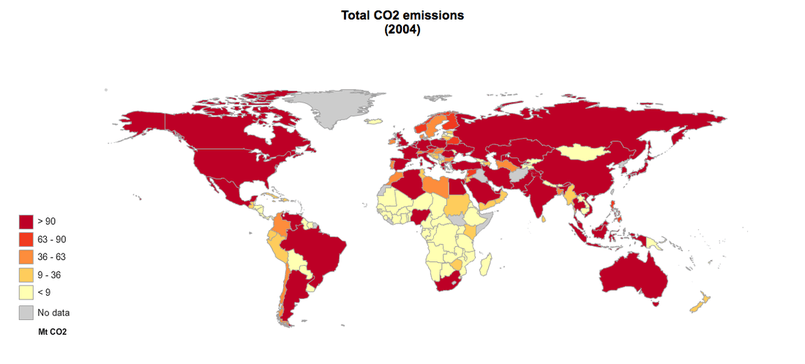
According to this chloropleth map, which countries produced >90 C02 emissions in 2004? Select all that apply.
Australia
The United States
China
Brazil
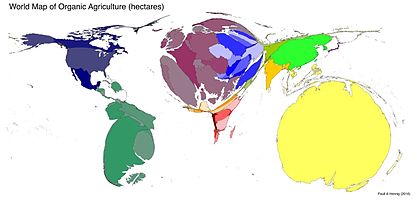
Which type of map is this?
Isoline
Chloropleth
Proportional Symbol
Dot
Cartogram

The images show a topographic map and a geographic information systems (GIS) representation of Mount Shasta in California. Which of the following statements best explains why these printed images are geometrically distorted representations of Earth’s surface?
Some maps do not show the actual coloration of Earth’s surface and vegetation.
GIS can only display two-dimensional layers.
The planet’s gravitational poles are not located at the poles of Earth’s axis.
The three dimensions of Earth’s surface are displayed on a two-dimensional page.
Printed maps alter the sense of place that people can have about a location.

A political polling company wants to use census data to collect information on voters in a city by neighborhood. Based on the types of information collected in the survey form, which of the following could be mapped using census data?
The number of voting-age residents per household
The political party affiliation of the average resident
How residents voted in the last election
How voters might vote in the next national election
How voters stand on current issues

An international company is looking to expand its network of factories, which use labor-intensive production methods, in a region of the world experiencing significant growth in the working-age population. Based on the data in the table, which of the following regions should the company choose?
North America, which will have faster working-age growth in 2015 to 2030 than in 2000 to 2015
Asia, which will have a faster working-age growth rate in 2015 to 2030 than in 2000 to 2015
Latin America, which had the fastest working-age growth rate among world regions from 2000 to 2015
Asia, which will have the fastest working-age growth rate among world regions from 2015 to 2030
Sub-Saharan Africa, which will have the fastest working-age growth rate among world regions from 2015 to 2030

