
 Worksheets
Test Review 1-1 KAP
Total questions: 19
Worksheet time: 5hrs 45mins
How many cars are in the parking lot?
Choose the statistical question:
What time did you wake up this morning?
What time do sixth graders typically wake up during the school week?
What time does school open its doors for students to enter?

Which situation would yield data that varies?
The sport 6th graders most enjoy playing
The number of students who played football last season
The sport which had the largest student attendance at one game


What is the mode of the scores? (the one that occurs most often)
24
14
34
30
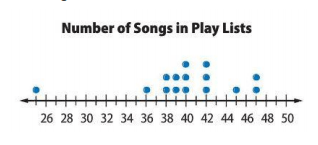
Which statement best describes this graph?
There is a peak at 47.
There is a cluster around 38-40.
The mode is 40.
There is a gap in the data between 39-40.

What is the Interquartile Range (IQR) in the data set?
15
3
2
0
4. Which of the following lists all the five numbers needed to make a box plot?
Mean, Median, Mode, Range, and Total
Minimum, Quartile 1, Median, Quartile 3, and Maximum
Smallest, Q1, Q2, Q3, and Q4
Minimum, Maximum, Range, Mean, and Median


Asymmetric, with a spread of 89 years
Skewed, with a spread of 45 years
Symmetric, with a spread of 14 years
Skewed, with a spread of 89 years




Determine the IQR for this set of data. 12, 13, 14, 15, 17, 18, 19, 19, 22, 23
14
5
17.5
19


In how many games did the team score more than 20 points?
8
7
10
9

Based on this graph , how many more sunny days than rainy days did the city have during the months of April, May and June ?
21
-1
I Don’t know
23

Based on the graph,how many more sunny days than rainy days did this city have during the months of April, May, and June?

