
 Worksheets
Graphs
Total questions: 12
Worksheet time: 13mins
Name
Class
Date
1.

How many people have four books in their desks?
a)
2
b)
3
c)
4
d)
5
2.

How many more students liked hockey and baseball combined than basketball?
a)
1
b)
4
c)
5
d)
9
3.

What fraction of this shape is orange?
a)
2/8
b)
8/2
c)
3/8
d)
2/7
4.

What type of graph is this?
a)
Bar Graph
b)
Line Plot
c)
Pictograph
d)
Tally Chart
5.

When was the greatest amount of shoppers at the store?
a)
10am
b)
1pm
c)
6pm
d)
2pm
6.

How many push-ups were done on Monday?
a)
5
b)
10
c)
15
d)
20
7.

Between which two days was the greatest decrease in push-ups?
a)
Friday and Saturday
b)
Tuesday and Wednesday
c)
Sunday and Monday
d)
Thursday and Friday
8.

What was the bear population in 2001?
a)
40
b)
45
c)
50
d)
55
9.
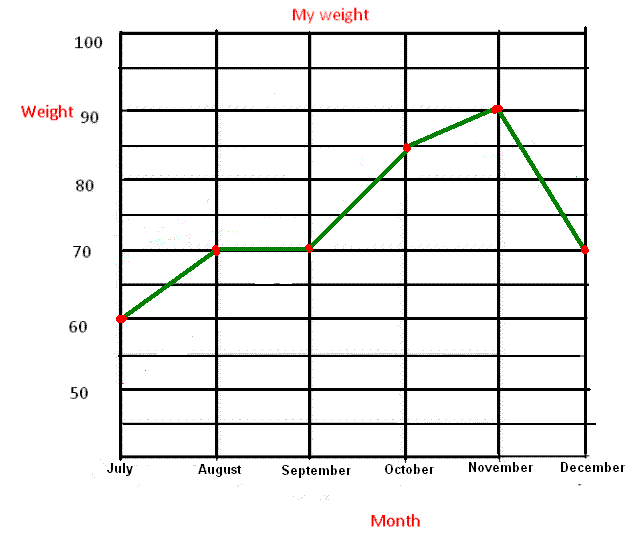
In which month was my weight the highest?
a)
July
b)
September
c)
November
d)
December
10.
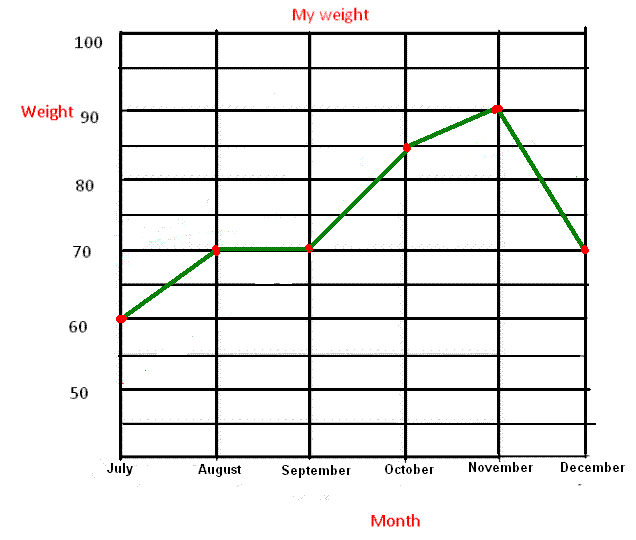
What was the overall trend on this graph?
a)
decreasing
b)
increasing
11.
The Y axis is _______?
a)
Vertical
b)
Horizontal
c)
criss-cross
d)
diagonal
12.
The X axis is _______?
a)
vertical
b)
diagonal
c)
criss-cross
d)
horizontal
100 %

