
Font size
 Worksheets
Boxplots Free response
Total questions: 24
Worksheet time: 2hrs 0mins

What was the lowest score?
(a)
What was the median score?
(a)
What is the lower quartile?
(a)
What was the highest score?
(a)
What is the interquartile range?
(a)

What is the median?
(a)
What is the upper quartile?
(a)

The box-and-whisker plot displays the number of inches of snowfall last year for 14 cities. Each city had a different amount of snowfall.
What percent of the cities had more than 64 inches of snow?
(a)

Consider the boxplot below. What is the interquartile range (IQR)?
(a)
Consider the boxplot below. What is the minimum?
(a)
Consider the boxplot below. What is the range?
(a)
The box-and-whisker plot displays the number of inches of snowfall last year for 14 cities. Each city had a different amount of snowfall.
What is the median amount of snow that fell?
write the value, not the units
(a)
What percentage of students scored a 39 or higher?
(a)

What percent of students have a height between 58 inches and 60 inches?
(a)


How would you describe the shape of this boxplot?
Skewed Right
Skewed Left
Symmetrical

Choose the right-skewed boxplot


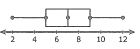
Which of the following best describes the shape of the distribution?
skewed left
skewed right
uniform
symmetrical
What shape does this boxplot have?
Symmetrical
Right Skew
Left Skew
DJ Screw

What shape is this boxplot?
Symmetrical
Right Skew
Left Skew
DJ Screw

Which squirrels have a roughly symmetrical distribution?
Red
Grey
They Both Do
Neither

Which group has a left skew?
Group A
Group B
Both A and B
Neither
Choose the symmetric boxplot



