wayground logo

Free Printable Worksheets

Font size

S
M
L
XL
Worksheets

Quiz 1

Total questions: 36

Worksheet time: 3hrs 0mins

Name
Class
Date
1.

You know 1000 mg = 1 g. Convert 2.5 grams into milligrams.

a)

25 mg

b)

25,000 mg

c)

250 mg

d)

2500 mg

2.
5000 millimeters = ____ meters
a)
5
b)
50
c)
500
d)
25
3.
1800 milligrams = ___ grams
a)
1.8
b)
18
c)
180
d)
.18
4.
1000 g= ______ kilogram(s)
a)
1
b)
10
c)
100
d)
1000
5.
1 L = _______ mL
a)
1
b)
10
c)
100
d)
1000
6.
1 cm = ________mm
a)
1
b)
100
c)
10
d)
1000
7.

The Olympic record for the high jump is just over 2.6 yards. What is that distance in feet? (3 ft = 1 yd)

a)

0.867 ft

b)

7.8 ft

c)

8.07 ft

d)

8.27 ft

8.

Americans drink 5,604,000 gallons of sweet tea each day. How many liters is that? (1 gal = 3.79 L)

a)

21,200,000 L

b)

21,240,000 L

c)

21,207,190.2 L

d)

21,000,000 L

9.

The waiting time to ride a roller coaster is 20 minutes when 150 people are in line. How long is the waiting time when 240 people are in line?

a)

32 people

b)

32 minutes

c)

12.5 minutes

d)

12.5 people

10.

How many kilograms of calcium are there in 173 pounds of calcium? (1 lb = 454 g; 1 kg = 1000 g)

a)

1.10 kg

b)

78.5 kg

c)

110 kg

d)

78500 kg

11.

How many minutes are in a school year, 187 days?

a)

269,280 min.

b)

16, 200 min.

c)

16, 156 min.

d)

269,000 min.

12.
What month has the least birthdays ?
a)
Dec
b)
Aug
c)
Jan
d)
Sep
13.
How many people have four books in their desks?
a)
2
b)
3
c)
4
d)
5
14.
Which statement best describes the trend in the data?
a)
As temperatures increase, ice cream cone sales increase.
b)
As temperatures increase, ice cream cone sales decrease.
c)
As temperatures decrease, ice cream cone sales increase.
d)
There is no trend in the data.
15.
What type of slope?
a)
positive
b)
negative
c)
no slope
d)
undefined
16.
What type of slope?
a)
negative
b)
positive
c)
zero slope
d)
downward slope
17.
Identify the outlier for the given data?
23, 34, 27, 7, 30, 26, 28, 31, 34

a)
7
b)
23
c)
31
d)
34
18.

Describe the data distribution shape of the graph.

a)

Mirror Image

b)

Skewed

c)

Uniform

d)

Symmetrical

19.
The y-axis shows
a)
time
b)
carbon dioxide concentration
c)
Mauna Loa volcano
d)
science
20.
This data set shows that
a)
there is more CO2 in the atmosphere now than ever before
b)
Hawaii will be most affected by global warming
c)
global temperatures are rising
d)
there is more CO2 in Hawaii than anywhere else
21.
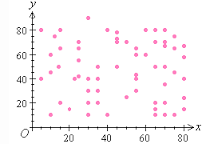
What sort of trend do you see in this scatter plot?
a)
Negative correlation
b)
Positive correlation
c)
No correlation
d)
No trend line exists
22.

Categorical data such as eye color and birthplace is called __________

a)

qualitative

b)

quantitative

23.

Numeric and measurable types of data such as height, age, scores, cost are called __________

a)

qualitative

b)

quantitative

24.

Describe the correlation in the graph shown.

a)

A) Strong Negative

b)

B) Strong Positive

c)

C) Weak Negative

d)

D) No Correlation

25.

Estimate the correlation coefficient for this scatterplot.

a)

A) r = 1.2

b)

B) r = 0.89

c)

C)r = 0

d)

D) r = -0.89

26.

Estimate the correlation coefficient for this scatterplot.

a)

A) r = -0.9

b)

B) r = 1

c)

C) r = 0.9

d)

D) r = -1

27.

Which with is the line of best fit?

a)

A) Black

b)

B) Orange

c)

C) Red

d)

D) Blue

28.

What type of correlation does this graph show?

a)

A) Positive

b)

B) negative

c)

C) none

d)

D) all of the above

29.

What type of correlation (association)?

The outside temperature and the amount of layers you wear.

a)

A) Positive correlation

b)

B) Negative correlation

c)

D) No correlation

30.
a)
Positive correlation
b)
Negative correlation
c)
No correlation
31.
The price of a pizza and the number of toppings added.
a)
Positive correlation
b)
Negative correlation
32.
The amount of coffee you drink and how many hours you stay up.
a)
Positive correlation
b)
Negative correlation
33.
a)
Positive correlation
b)
Negative correlation
c)
No correlation
34.
a)
Positive correlation
b)
Negative correlation
c)
No correlation
35.
How much you eat and how hungry you will be.
a)
Positive correlation
b)
Negative correlation
36.
The number of hours you spend studying the the grade you receive on a test.
a)
Positive correlation
b)
Negative correlation