Wayground logo

Free Printable Worksheets

Font size

S
M
L
XL
Worksheets

METRICS, GRAPHS & DATA TABLES TEST

Total questions: 55

Worksheet time: 55mins

Name
Class
Date
1.
Is 20 g greater than, less than, or equal to 2 kg?
a)
greater than
b)
less than
c)
equal to
2.
How many sophomores like burritos and pizza?
a)
6
b)
5
c)
11
d)
50
3.
Data tables should contain 
a)
a title, independent variable, dependent variable and units of measurement if used
b)
a title, independent variable, dependent variable and the hypothesis
c)
a title, independent variable, dependent variable and  the observation
d)
an observation, problem and hypothesis
4.

What color car is the most popular at this car dealership?

a)

Red

b)

White

c)

Blue

d)

Green

5.

At what age are boys supposed to intake the highest amount of calories daily?

a)

14-18 years

b)

9-13 years

c)

4-8 years

d)

2-3 years

6.

The table lists the temperatures recorded from the surfaces of different objects on different dates. Which factor seems to affect how much heat surfaces absorb?

a)

Time of year

b)

Shape of object

c)

Number of measurements

d)

Type of material

7.

Using the chart, what conclusion can be drawn about the relationship between breathing rate and type of activity?

a)

The more demanding the activity is, the higher the breathing rate will be.

b)

There is no direct relationship between breathing rate and type of activity

c)

There is an inverse relationship between breathing rate and type of activity.

d)

The resting pulse rate is always one third that of the active pulse rate.

8.

Which brand of tires appears to make Juan's model car go the fastest?

a)

Brand B

b)

Brand A

c)

Brand C

d)

Brand D

9.

In which water temperature did the goldfish have an average breathing rate of 28.75? (hint: Calculate the average mean for each temperature!)

a)

8 Celsius

b)

14 Celsius

c)

2 Celsius

d)

20 Celsius

10.
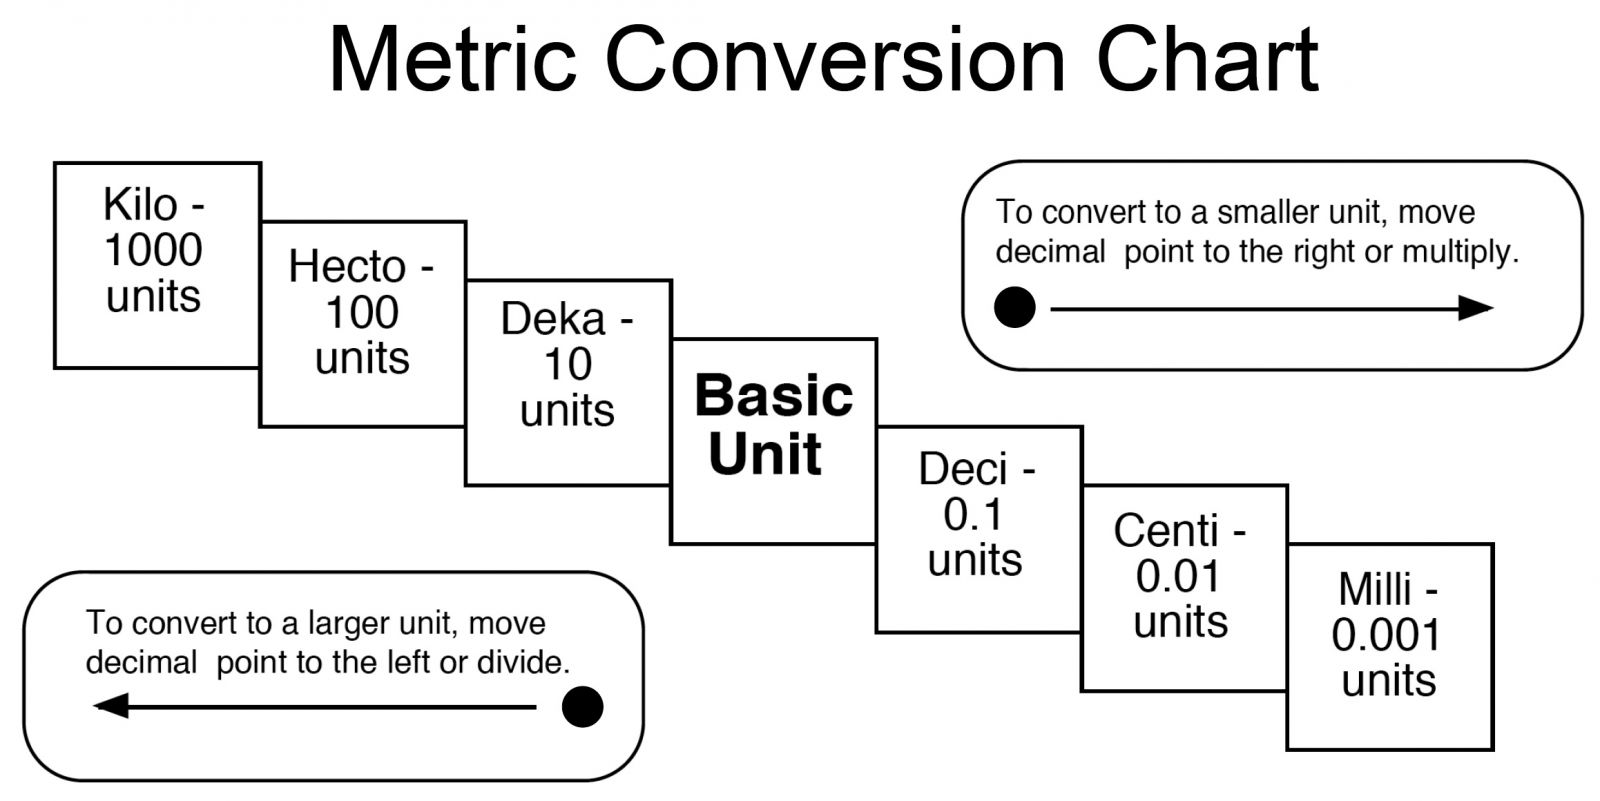
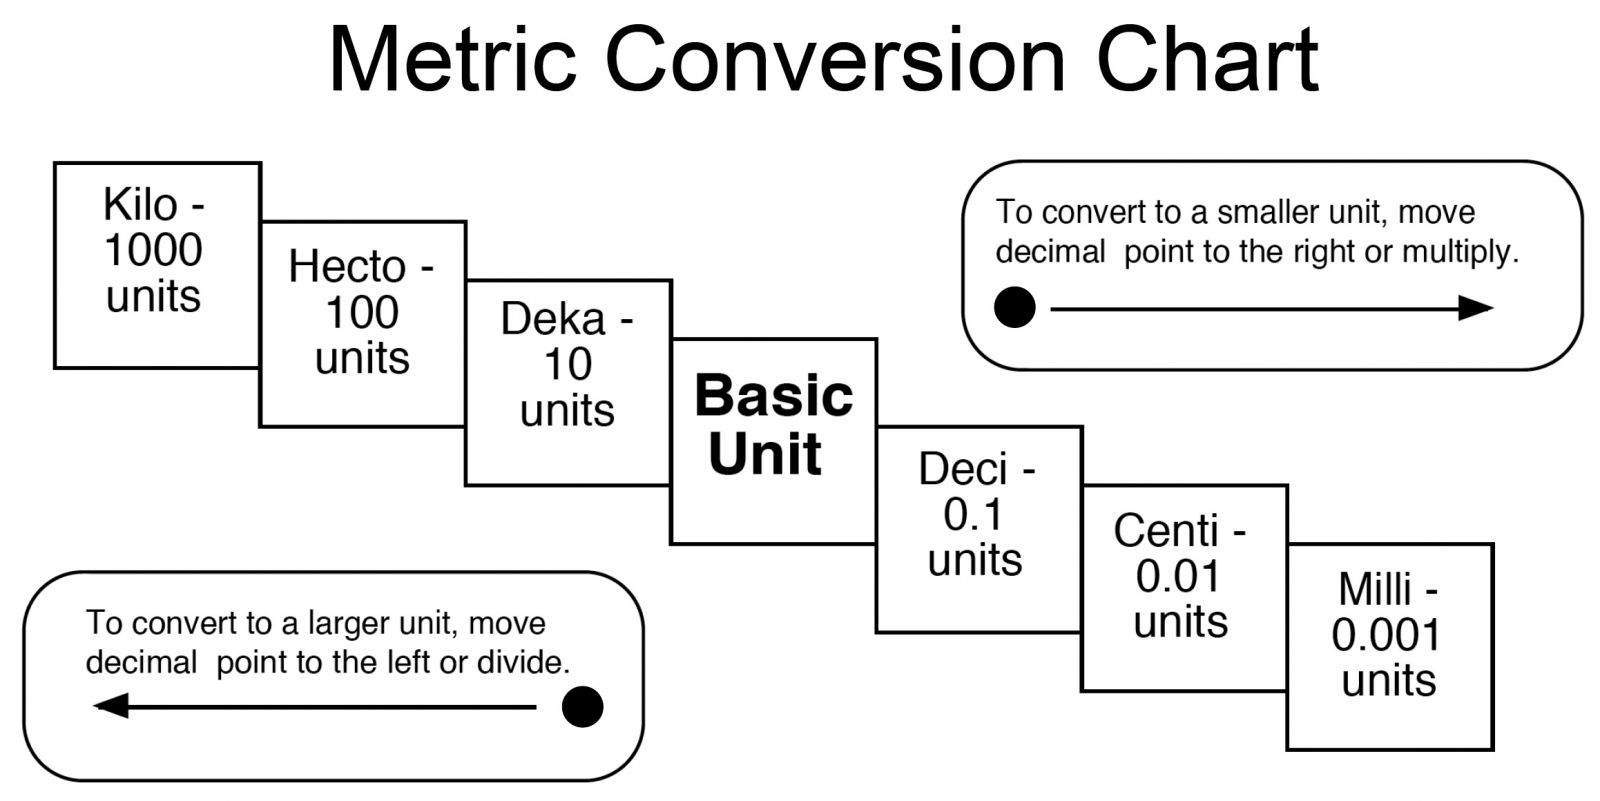
80 mm = ____ cm 
a)
.8
b)
800
c)
8
d)
8,000
11.
20,000 cm = ____ m
a)
200
b)
2,000
c)
20
d)
200,000
12.

490,000 g =____ kg

a)

490

b)

49

c)

4,900

d)

0.49

13.

285 kg = ____ g

a)

285,000

b)

2,850

c)

285

d)

28,500

14.

Convert 5 cm to mm:

a)

5,000mm

b)

0.05 mm

c)

0.5 mm

d)

50 mm

15.

Convert 300 cm to Km:

a)

3 Km

b)

0.03 Km

c)

0.3 Km

d)

0.003 Km

16.

Convert 17 m to cm:

a)

0.17 cm

b)

1,700 cm

c)

0.017 cm

d)

170 cm

17.

Convert 3.75 kg to grams.

a)

375 g

b)

37.5 g

c)

3750 g

d)

3.75 g

18.
The basic unit of metric volume is called a_____.
a)
Meter
b)
Gram
c)
Liter
d)
Metric
19.
The base unit for mass is the
a)
Meter
b)
Gram
c)
Metric
d)
Liter
20.
The base unit of metric length.
a)
Meter
b)
Liter 
c)
Gram
d)
Metric
21.

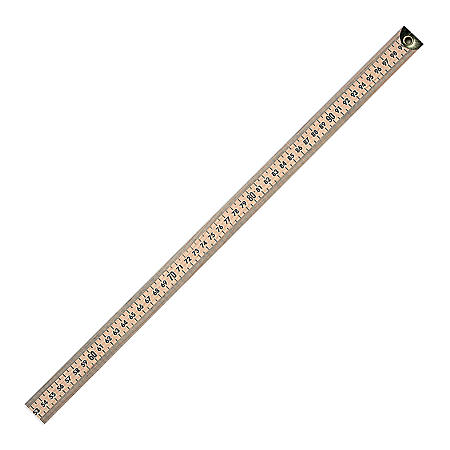
What is the reading at point d?

a)

3.2 cm

b)

3.2 mm

c)

3.2 grams

d)

3.2 liters

22.
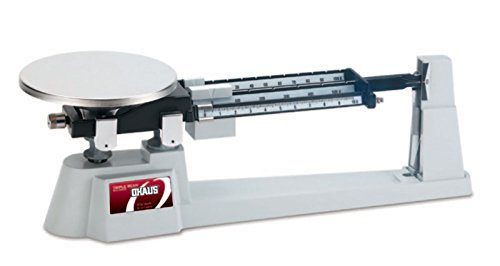
What is the mass reading on the triple beam balance?
a)
336.8 g
b)
336.8 m
c)
306.8 g
d)
306.8 m
23.

Kacey has two dogs. One dog weighs 23 kilograms. The second dog weighs 12,000 grams. What is the difference in weight between her two dogs?

a)

35,000 grams

b)

12,023 grams

c)

11,977 grams

d)

11,000 grams

24.
A meter is equal to how many centimeters?
a)
1000
b)
100
c)
10
d)
1
25.

Which statement is true?

a)

4 liters 300 milliliters > 4,000 milliliters

b)

4 liters 300 milliliters < 4,000 milliliters

c)

4 liters 300 milliliters = 4,000 milliliters

d)

4,000 milliliters > 4 liters 300 milliliters

26.
How many students spent 7 hours doing homework that week?
a)
1
b)
3
c)
5
d)
6
27.
On the coordinate plane, which line is the y-axis?
a)
Horizontal Line (Side to Side)
b)
Vertical Line (Up and Down)
28.
On the coordinate plane, which line is the x-axis?
a)
Horizontal Line (Side to Side)
b)
Vertical Line (Up and Down)
29.

What type of graph should be used for this data?

a)

Line

b)

Bar

30.

What is the independent variable in this data?

a)

Number of Cars

b)

Car Color

c)

There is no independent variable shown.

31.

What type of graph should be used with this data?

a)

Line

b)

Bar

32.

What goes on the x-axis? Choose all correct answers

a)

Independent Variable

b)

Dependent Variable

c)

Day of Week

d)

High Temperature

33.

What would be the best label for the y-axis of your graph?

a)

Day of Week

b)

Day

c)

Temperature

d)

Temperature (ºF)

34.

What type of graph should be used for this data?

a)

Line

b)

Bar

c)

Pie

d)

Scatter plot

35.

Which title would be the best for this graph?

a)

Science Classes

b)

Which Science Class is Most Popular in High School?

c)

Number of Students by Science Class

d)

Number of Students by Science Class at Bourbon County High School

36.
On which axis is the independent variable found?
a)
z-axis
b)
w-axis
c)
y-axis
d)
x-axis
37.
Which variable is found on the y-axis?
a)
Independent
b)
Manipulated
c)
Dependent
d)
Input
38.
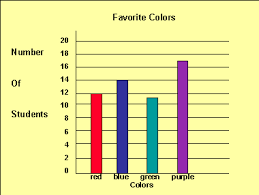
How many total people took the survey?
a)
50
b)
150
c)
100
d)
200
39.
How many more people have purple for a favorite color than red?
a)
3
b)
5
c)
7
d)
9
40.
Which team had more slam dunks, Hawks or Bulls?
a)
Bulls
b)
Hawks
41.

What type of Graph is this?

a)

Bar Graph

b)

Science Graph

c)

Circle Graph

d)

Pie Graph

42.

What type of graph is this?

a)

Bar Graph

b)

Line Graph

c)

Double Line Graph

d)

Pie Graph

43.
Which sport is the least favorite? 
a)
baseball
b)
football
c)
hockey
d)
basketball
44.

Finish the statement: After 5 minutes, the battery charge increases by _____.

a)

10%

b)

50%

c)

40%

d)

5%

45.

Does this graph represent a proportional relationship?

a)

Yes, because it doesn't start at the origin.

b)

Yes, because it shows a constant rate of change.

c)

No, because it doesn't start at the origin.

d)

No, because it shows a constant rate of change.

46.

What is the meaning of the point (20, 5)?

a)

If she delivers 20 newspapers, she will earn $5.

b)

If she earns $20, she will deliver 5 newspapers.

47.
According to this graph, what is the most popular flavor of Jolly Rancher?
a)
Cherry
b)
Grape 
c)
Blue Rasberry
d)
Watermelon
48.

Which country doubled the amount of aid they received between 1965 and 1975?

a)

Egypt

b)

Tunisia

c)

Pakistan

d)

None of them

49.
In August, how many metric tons did Clark's Paper Mill and Tyler Paper Mill produce all together?
a)
10
b)
70
c)
80
d)
90
50.

What percentage does the entire circle graph represent?

a)

100%

b)

50%

c)

25%

d)

15%

51.
Which sentence describes the relationship shown on this scatter plot?
a)
As the temperature decreases, the visitors increase. 
b)
As the temperature increases, the number of visitors increases. 
c)
As the visitors increase, the temperature decreases. 
d)
No correlation
52.
What type of association does this scatter plot represent?
a)
positive linear association
b)
negative linear association
c)
no association
d)
nonlinear association
53.
Which scatter plot shows a linear relationship between x and y?
a)
Graph A
b)
Graph B
c)
Graph C
d)
Graph D
54.
What type of correlation does this scatter plot show?
a)
positive linear association
b)
negative linear association
c)
no association
d)
nonlinear association
55.
What type of correlation does this graph have?
a)
positive
b)
negative
c)
none
d)
all of the above