
 Worksheets
IED TEST 1: Box Plots+Design Process
Total questions: 35
Worksheet time: 58mins
The design process is....
a systematic way to rule out group ideas
a ranking system where a score is given for categories
a systematic method used by engineers to solve problems
Which step of the design process includes "Brainstorming"?
Define problem
Generate concepts
Build a prototype
When you build your prototype it is really important to do this...
Rebuild it
Test it many times
Present it
Designing a solution means to...
Come up with a detailed plan
Brainstorm
Present your findings
When designing a solution you should also create this:
A built selected model
An assessment of your model
A technical drawing
Presenting your solution is like:
Looking for flaws
Pitching your sales idea
Brainstorming
Asking things like "What is the issue we need to solve?", or "What are my criteria/constraints?"...would be which step?
Design a solution
Generate Concepts
Define Problem
When I look for and collect data for FLAWS in my design, I am at this step:
Design a solution
Build/Test prototype
Evaluate solution
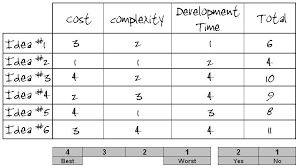
Using one of these will help your group decide on which model to build:
Design Brief
Design Evaluator
Decision Matrix
We usually draw a rough sketch during this step:
Generate Concepts
Build/Test Prototype
Evaluate Solution
If I find flaws in my solution I should....
Create a technical drawing instead
Be formal and perfect
go back and make modifications before moving forward
What do we call limitations like "time, cost and/or materials" within a challenge?
Complications
Constraints
Criteria
What are the "Must-Haves" in a project or challenge called?
Criteria
Constraints
Brainstorming
Adding a detailed drawing of the group's idea is completed at this step of the design process.
Define the problem
Design a solution
Evaluate solution
Even though we can "always" go back and fix a flawed solution, at what step would it be hardest to "go backwards"?
When you are building/testing a prototype
When you are evaluating a solution
When you are presenting your solution

Based on this chart, which idea was best?
Idea 2
Idea 6
Idea 3
Idea 4

Which Idea was "WORST" for development time?
Idea 5
Idea 3
Idea 2
Idea 1

Which step is most likely represented here?
Define Problem
Design A Solution
Build and Test
How many stages are there in the design process?
6
10
7
8







What is the interquartile range (IQR)?
20
25
30
50

What is the the first quartile for the data on the 6TH Grade Math Test?
68
78
85
93
What is the the third quartile for the data on the 6TH Grade Math Test?
68
78
85
93

What is the third quartile on this box plot?
52
54
56
63
4. Which of the following lists all the five numbers needed to make a box plot?
Mean, Median, Mode, Range, and Total
Minimum, Quartile 1, Median, Quartile 3, and Maximum
Smallest, Q1, Q2, Q3, and Q4
Minimum, Maximum, Range, Mean, and Median


Which group of people has 50% of the data above 5 magazines each day?
Children
Adults

What percent of the data falls between 8 and 10 absences?
0%
25%
50%
75%
100%

What percent of students read between 280 and 340 words per minute (wpm)?
0%
25%
50%
75%
100%

What percent of the data is below 80?
0%
25%
50%
75%
100%

