
 Worksheets
PS- Quiz 2.1
Total questions: 25
Worksheet time: 1hrs 4mins




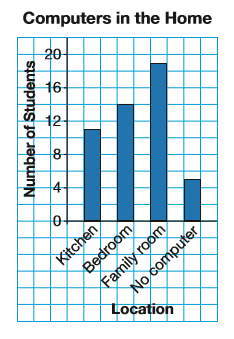
How many students were asked?
48 students
49 students
51 students
52 students


How many people have 4 or more pets?
8
3
6
4
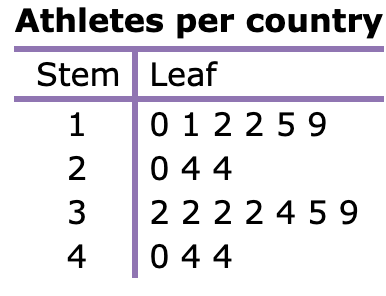
While doing a project for P. E. class, Ling researched the number of athletes competing in an international sporting event.
How many countries have exactly 32 athletes?
4
3
6
1

A machine dispensed red gumdrops into bags of various sizes.
How many bags had at least 15 red gumdrops?
33
23
25
27

A farmer counted the number of apples on each tree in her orchard.
How many trees have at least 30 apples but fewer than 60 apples?
2
4
0
3

A restaurant recorded the number of pizzas sold each month for one year. The data are shown in the graph below. During which month did the restaurant sell 40 pizzas?
March
May
July
August

Annie recorded the amount of rain that fell each day. The results are shown in the line graph below. How many centimeters of rain fell on the third day?
2
3
4
7
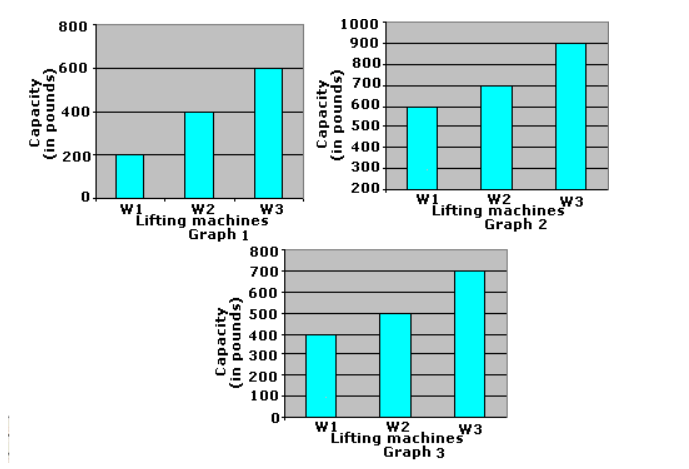
Which graph is misleading?
graph 1
graph 2
graph 3
graph 2 and 3
Which graph is the "bad" one?


What is the mean of the data shown, to the nearest whole number?
33
34
35
32

What is the shape of the data?
Symmetrical
Skewed RIGHT
Skewed LEFT

What is the range?

Type of Data arrangement
Symmetrical
Uniform
Skewed Right
Skewed Left

Skewed Left
Skewed Right
Symmetric
Uniform

Skewed Left
Skewed Right
Symmetric
Uniform


Describe the shape of the distribution
Symmetric
Left Skewed
Right Skewed
Uniform

Symmetric Distribution

Right-skewed Distribution

Left-skewed Distribution

