
 Worksheets
graphs
Total questions: 18
Worksheet time: 1hrs 24mins
Name
Class
Date
1.

How many more people like purple than red?
a)
3
b)
5
c)
7
d)
9
2.

CHALLENGE
How many more students had five candy bars than two candy bars?
a)
4
b)
3
c)
5
d)
2
3.
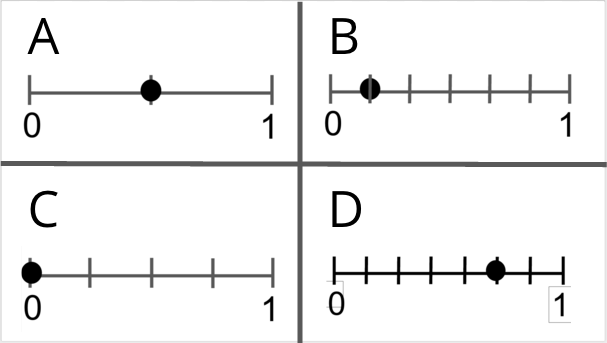
Which number line shows 1/2?
a)
A
b)
B
c)
C
d)
D
4.

How many more runs did Tracy have than Sarah and Patty combined?
a)
6
b)
8
c)
2
d)
1
5.

What two activities had the least amount of votes when combined?
a)
School Clubs and Chat Online
b)
Visit with Friends and Play Sports
c)
Earn Money and Watch TV
d)
Chat Online and Play Sports
6.

How many total students studied for the test?
a)
70
b)
35
c)
34
d)
36
7.

Which amount of minutes did the most students study for the test?
a)
70
b)
60
c)
55
d)
50
8.

On which day did the Ice Cream shop sell the greatest amount of Ice Creams?
a)
Tuesday
b)
Friday
c)
Saturday
d)
Sunday
9.

How many total ice cream was sold on Saturday and Sunday?
a)
11
b)
22
c)
44
d)
55
10.
How many total ice cream was sold on Saturday and Sunday?
a)
11
b)
22
c)
44
d)
55
11.

How many total ice cream did the shop sell for the entire week?
a)
26 1/2
b)
52
c)
104
d)
106
12.

Based on the data in the table, how many students played the three games that had the highest frequency?
a)
62
b)
57
c)
60
d)
61
13.

Based on the graph, how many more students are in the science club than the book club?
a)
20
b)
16
c)
46
d)
18
14.

The stem and leaf plot shows the scores of eight people at a poster making contest. What is the difference between the highest score and the lowest score?
a)
2.9
b)
2.7
c)
29
d)
27
15.

Did more people own a Wii or a PS3?
a)
Wii
b)
PS3
16.

Which month had the fewest books read?
a)
January
b)
February
c)
March
d)
April
17.
How old are you?
a)
Categorical
b)
Numerical
18.
In which month were you born?
a)
Categorical
b)
Numerical
100 %

