
 Worksheets
1st Six Weeks Review
Total questions: 25
Worksheet time: 1hrs 14mins

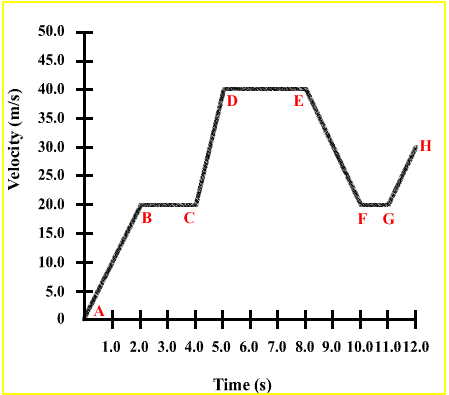
At what point is the person not moving?
A and C
B and D
D and E
A and E

The letter "A" shows...
A person returning to a starting point
A person walking away from a starting point
A person not moving
A person resting

What does this line represent?
The line represents super speed.
The line represents something that is speeding up.
The line represents something that is slowing down.
The line represents something that is not moving



What is the average speed of the entire movement of this object?
0 m/sec
.72 m/sec
.8 m/sec
1.45 m/sec

Which object has the faster average speed?
A
B
Both objects have the same average speed



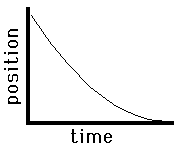
This position vs. time graph shows an object...
not moving
moving with constant velocity
moving with changing velocity

This velocity vs. time graph shows an object...
(Hint: For this graph, the velocity is 0 m/s!)
not moving
moving with constant velocity
moving with changing velocity
Which of these velocity vs. time graphs shows an object changing direction?


Which of these position vs. time graphs shows an object changing direction?


On a V-T Graph:
This shows speeding up and moving to the right:


On a V-T Graph:
This shows constant speed and moving to the right:


How would you calculate the distance it takes a softball player travels if she runs for 8 seconds at an average speed of 6.5 m/s?
6.5 ÷ 8
6.5 × 8
8 ÷ 6.5
8 - 6.5

How would you calculate the time it takes for a bird flying at a speed of 45 km/hr to travel a distance of 1,800 kilometers?
45 ÷ 1,800
45 × 1,800
1,800 ÷ 45
1,800 - 45

How would you calculate the speed of a baseball that takes 0.5 seconds to fly a distance of 20 meters?
0.5 ÷ 20
20 × 0.5
20 ÷ 0.5
0.5 - 20

How would you calculate the average speed of a student that is able to run 20 meters in 8 seconds?
20 ÷ 8
20 × 8
8 ÷ 20
8 - 20
Calculate the final velocity of an object that accelerates from rest for 3 seconds at a rate of 5 m/s/s.
75 m/s
15 m/s
8 m/s
0 m/s
What is the final velocity of an object that is thrown down at 5 m/s, and falls for 5 seconds in the absence of air resistance?
54 m/s
-54 m/s
25 m/s
49 m/s

