
 Worksheets
Graphing Stories
Total questions: 18
Worksheet time: 44mins
Name
Class
Date
1.

Between 4 and 8 seconds the helicopter's speed is .....................
a)
Increasing
b)
Decreasing
c)
Stationary
2.
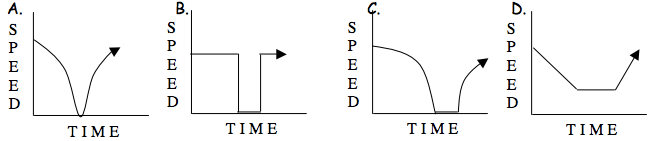
A driver stopped her car for a traffic light. After waiting for the light to turn green, the driver continued on her way.
a)
A
b)
B
c)
C
d)
D
3.
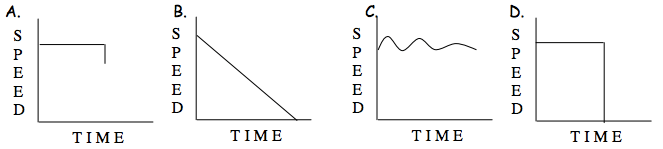
A train pulls into a station to let off its passengers.
a)
A
b)
B
c)
C
d)
D
4.
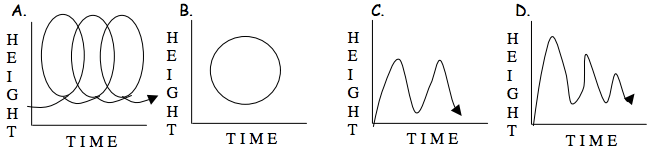
A girl takes a ride on a ferris wheel.
a)
A
b)
B
c)
C
d)
D
5.
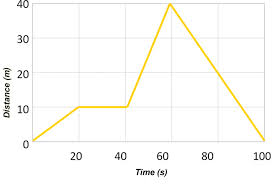
What does the X axis represent?
a)
Time
b)
Distance
6.
What does the Y axis represent?
a)
Time
b)
Distance
7.
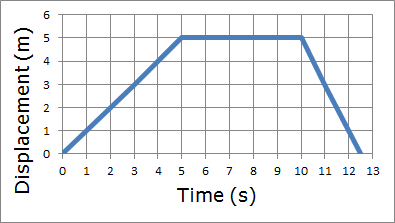
According to the graph how far does the person travel in the first 5 seconds?
a)
2 m
b)
10 m
c)
0 m
d)
5 m
8.

Between which seconds is the line INCREASING?
a)
Between 7 and 12 seconds
b)
Between 0 and 1 seconds
c)
Between 1 and 5 seconds
d)
Between 12 and 13.5 seconds
9.
Between which seconds is the line DECREASING?
a)
Between 7 and 12 seconds
b)
Between 0 and 1 seconds
c)
Between 1 and 5 seconds
d)
Between 12 and 13.5 seconds
10.
Between 4th and 8th seconds the helicopter's distance is .....................
a)
Increasing
b)
Decreasing
c)
Staying the same
11.

What happened on this graph from 0 to 7 seconds?
a)
The helicopter moved up.
b)
The helicopter stayed at the launching pad.
c)
The helicopter moved down.
d)
You can't tell from this graph.
12.

What is happening in this graph from point B to C?
a)
The object is going down a hill.
b)
The object is returning to its starting location.
c)
The object is slowing to a stop.
d)
The object is staying still.
13.
According to the graph how far does the person travel in the first 5 seconds?
a)
2 m
b)
10 m
c)
0 m
d)
5 m
14.

Which graph shows the object standing still?
a)
A
b)
B
c)
C
d)
D
15.

At what time did the car stop?
a)
4s
b)
10s
c)
13s
d)
21s
16.
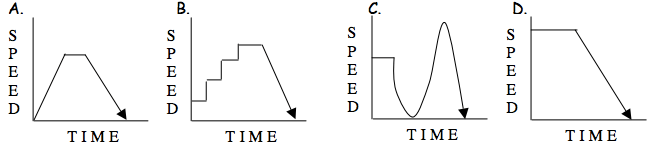
A child climbs up a slide and then slides down.
a)
A
b)
B
c)
C
d)
D
17.
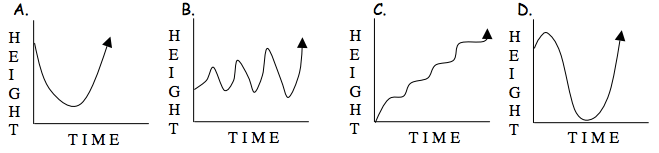
A child is on a swing.
a)
A
b)
B
c)
C
d)
D
18.
A girl takes a ride on a ferris wheel.
a)
A
b)
B
c)
C
d)
D
100 %

