
 Worksheets
PS: Quiz 5.1
Total questions: 25
Worksheet time: 1hrs 23mins
Number of pets a person has and number of books a person has read
Positive Correlation
Negative Correlation
No Correlation
Amount of Education and Amount of income
Positive Correlation
Negative Correlation
No Correlation
Number of days absent from school vs. math average
Positive Correlation
Negative Correlation
No Correlation

What type of Correlation?
Positive Correlation
Negative Correlation
No Correlation
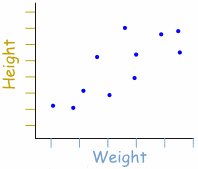
What type of correlation?
Positive Correlation
Negative Correlation
No Correlation

Determine the Correlation Coefficient.
-0.07
-0.26
0.26
0.07

Find the equation of the line of best fit for this table.
y = -0.18x + 6.47
y = 6.47x - 0.18
y = 0.04x - 0.19
y = -0.18x - 0.19

Which example shows CAUSATION? (Which one CAUSED the other to happen.)
Rainfall and time spent reading.
Eating more butter and increased divorce rates.
It started raining and the baseball game was delayed.
Which example shows CORRELATION? (The events show correlation, but one thing does NOT cause the other thing to happen.)
I put water in the freezer and now I have ice.
The alarm clock went off and I woke up.
Temperature and the amount of people at the beach.
Which of the following is the WEAKEST negative correlation?
-0.73
- 0.34
- 0.92
- 0.57

Describe the correlation coefficient if
r = 0.90
Positive, weak
Positive, strong
Negative, weak
Negative, strong

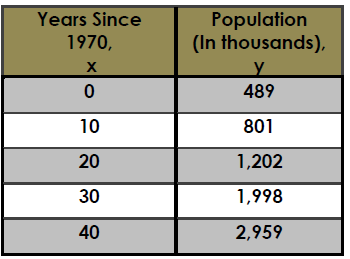


A chemist has a 100-gram sample of a radioactive material. He records the amount of radioactive material every week for 6 weeks and obtains the following data: Find the exponential model of the function.
y = 100(8.7)x
y = 100(1.88)x
y = 100(.88)x
y = 100(.13)x

As x increases, y increases.
correlation coefficient
causation
positive correlation
negative correlation
As x increases, y decreases.
correlation coefficient
causation
positive correlation
negative correlation
As x increases, y has so steady trend or regression.
correlation coefficient
no correlation
positive correlation
negative correlation

As shown in the table, a person's target heart rate during exercise changes as the person gets older. Use the graphing calculator to find the coefficient of determination.
-0.999
-0.664
0.998
1.503
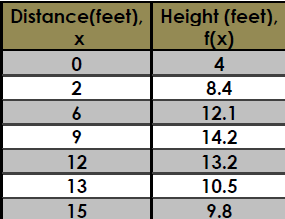
Find the height of the ball when it traveled a distance of 10 feet. Pay attention to what type of regression this is.
12.8 ft
13.3 ft
11.1 ft
17 ft

Using your graphing calculator determine coefficient of determination for the data in the table.
.942
0.888
0.765
0.222

