
 Worksheets
DATA HANDLING/PENGENDALIAN DATA
Total questions: 21
Worksheet time: 14mins
Hobi murid
Students' hobbies
Data numerik
Numerical Data
Data kategori
Categorical data
Tandakan (/) bagi nama carta yang betul
Mark (/) for the right name of the chart below


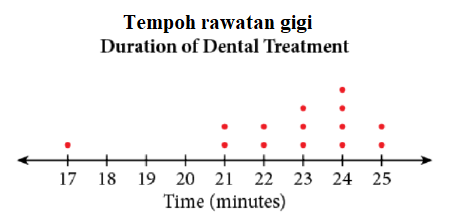
Tempoh rawatan paling lama
The longest duration of treatment is
17 minit
24 minit
25 minit

Skor bola sopak dari Adam
Number of goals scored by Adam
14
12
10
8

Tandakan (/) bagi jawapan yang betul
Mark (/) the right answer
Paling muda ialah berumur 10 tahun
The youngest is 10 years old
Data ini mengandungi 15 orang
The data shows 15 respondent

Berapakah perbezaan markah matematik Raju dan Nora?
What is the difference between Raju and Nora's math scores?
5
10

Tingkatan berapakah yang paling ramai dalam sekolah itu?
Which form has the largest number in the school?
Tingkatan 1
Tingkatan 2
Tingkatan 3
Tingkatan 4

Nombor buku yang paling sedikit ialah
The least number of books is
0
1
5
8
Apakah perwakilan yang sesuai untuk merekod tinggi murid?
Which chart is most suitable to record the height of students'?
Carta palang
Bar chart
Plot titik
Dot plot

Carta apa yang paling sesuai dengan perwakilan data ini?
Which chart is the most suitable to convert this bar chart?
Graf garis
Line graph
Plot batang dan daun
Stem and leaf plots


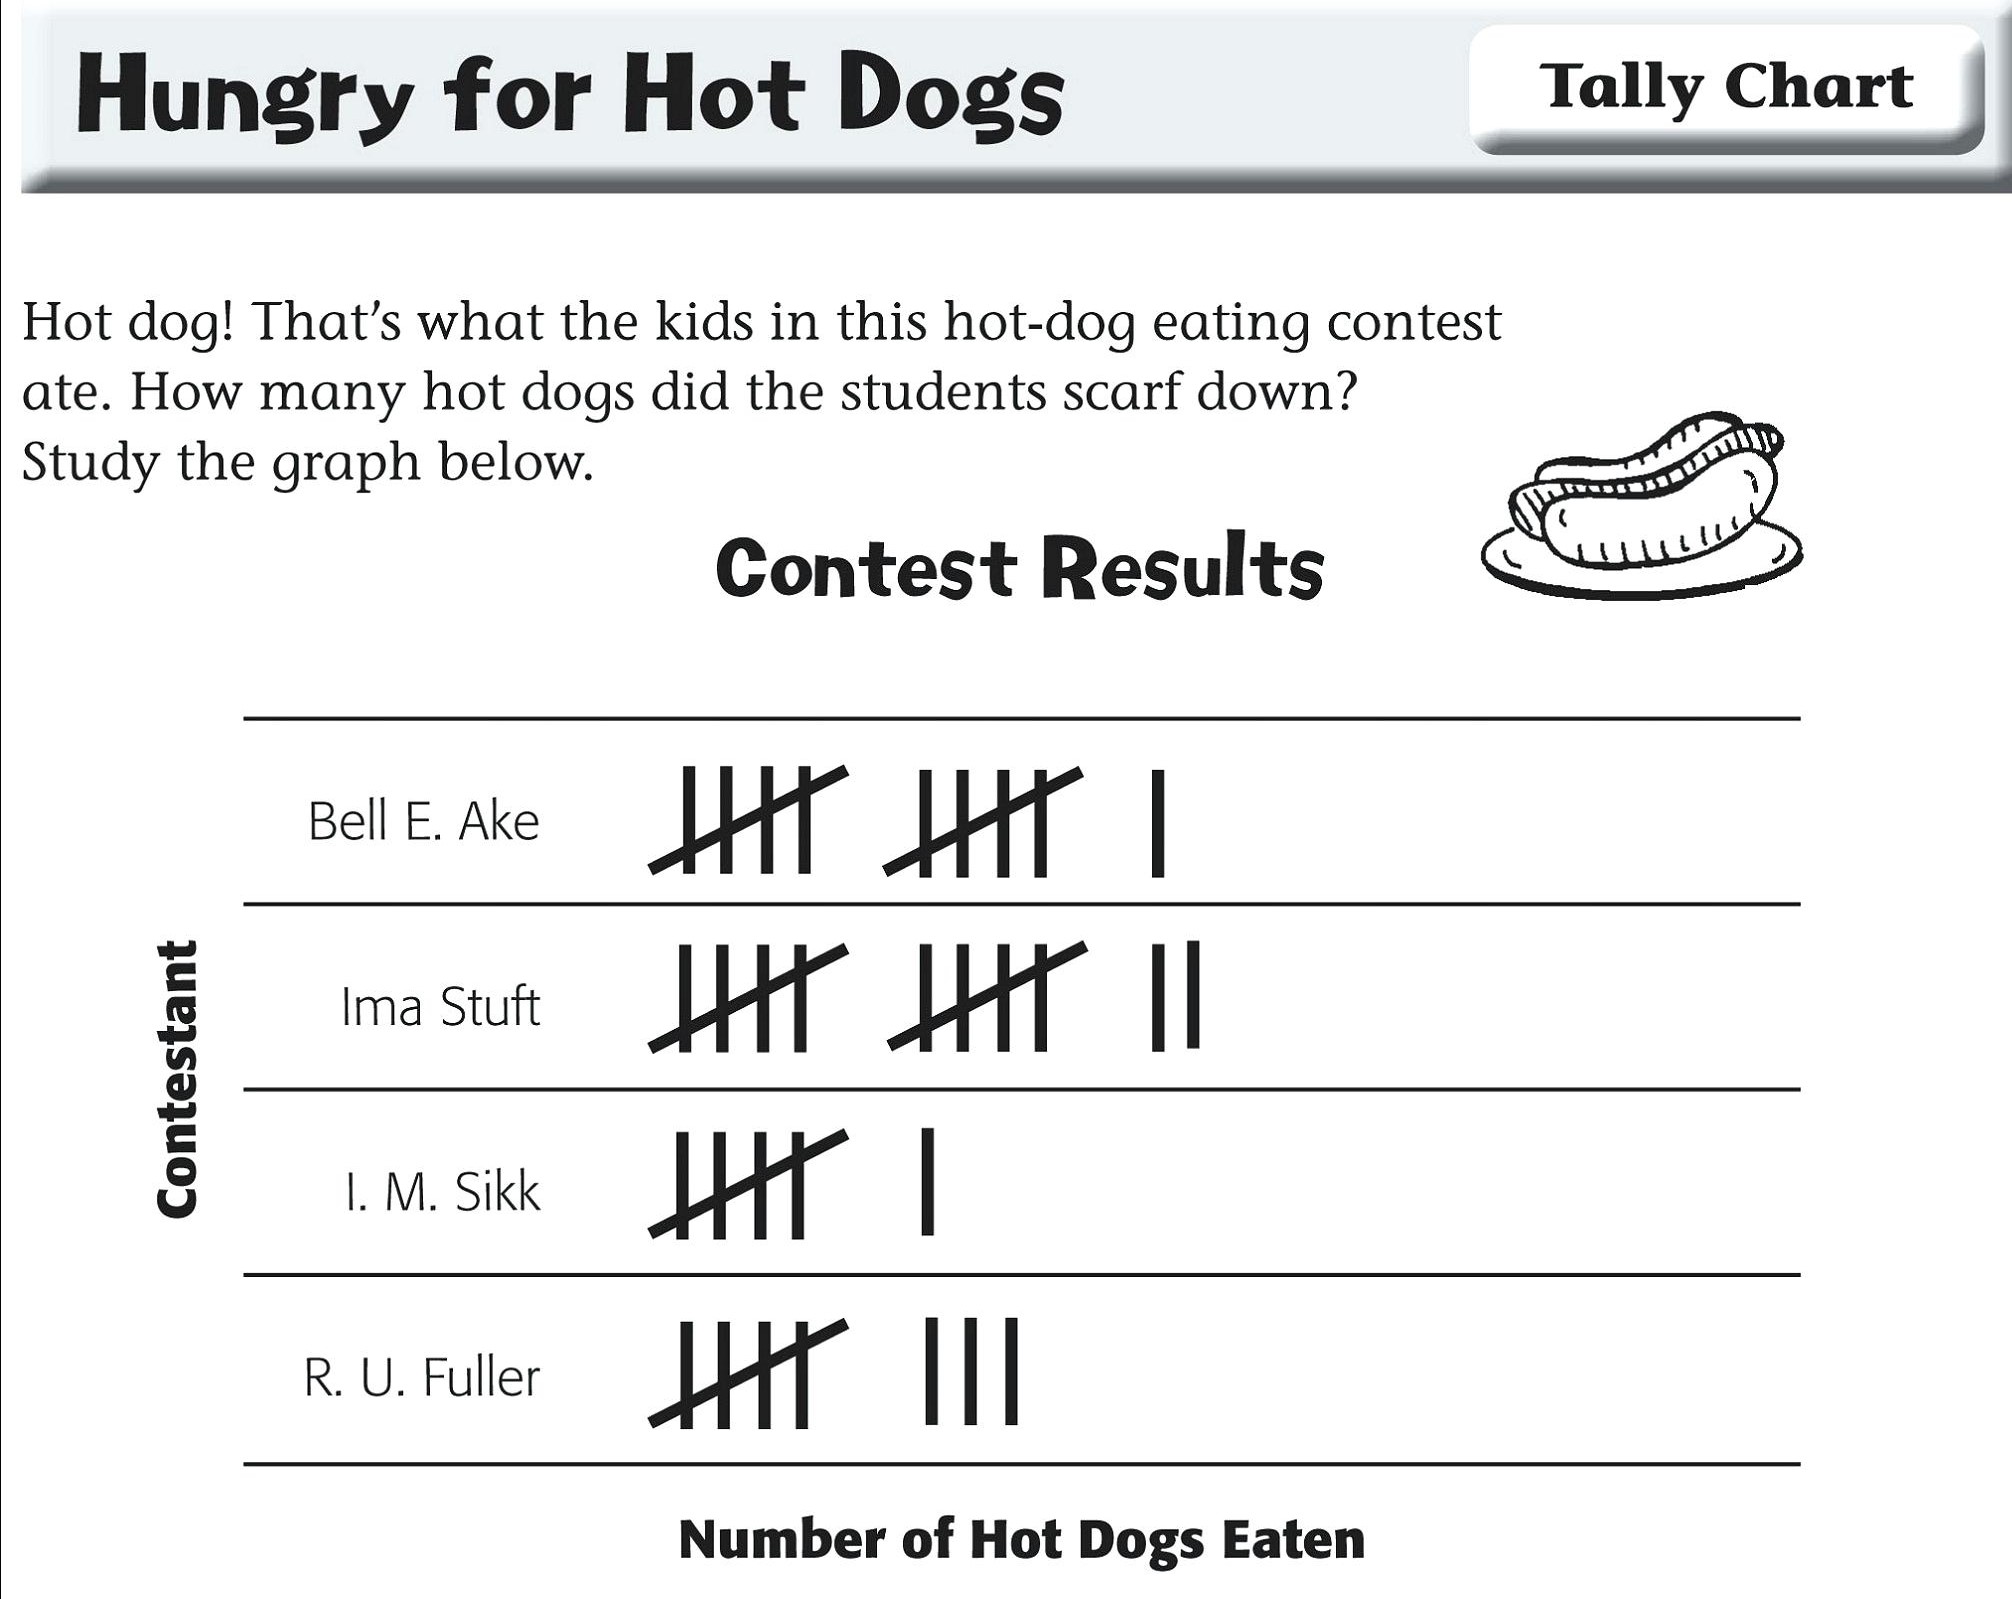
All together, how many hot dogs were eaten?
26
40
38
37




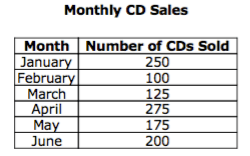
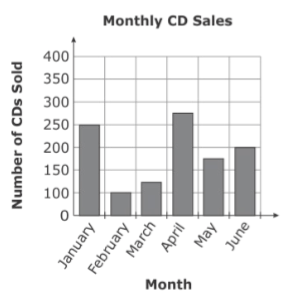
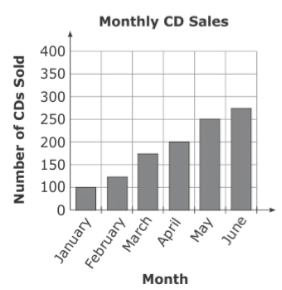
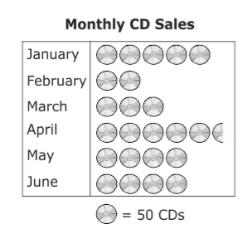
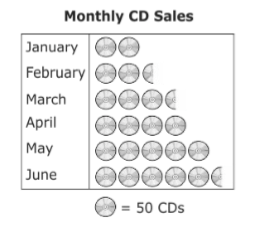
In the chart , a music store listed the number of CDs sold each month for 6 months. Which graph correctly represents the information in the chart?
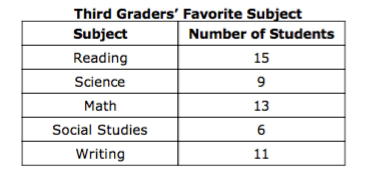
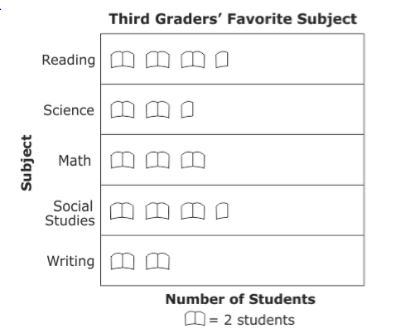
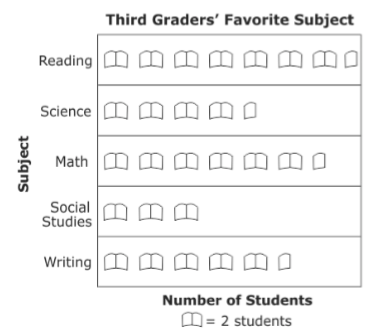
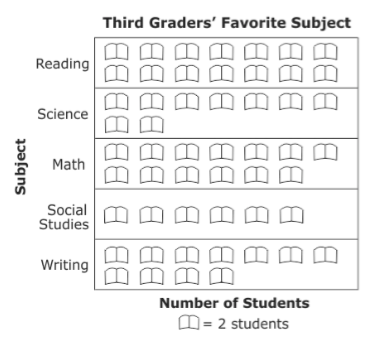
Students in 3rd grade collected data on their favorite subject and recorded it on the table shown. Which graph shows this information?

Rita went bird watching. The picture graph below shows the number and types of birds she saw. Which data set was used to make this graph?



