
 Worksheets
topic 4 Revision
Total questions: 21
Worksheet time: 42mins
Name
Class
Date
1.

What percentage of males drive sports cars?
a)
35%
b)
16.25%
c)
65%
d)
25%
2.

What percentage of SUV's are driven by women?
a)
56.25%
b)
75%
c)
83.25%
d)
86.5%
3.

How many people purchased no food and no drink?
a)
60
b)
10
c)
20
d)
200
4.

How many total people were surveyed about what ice cream flavor they would pick?
a)
107
b)
92
c)
70
d)
269
5.

What percent of the total population surveyed were electrical engineers that like math?
a)
33.9%
b)
48.6%
c)
16.5%
d)
21.7%
6.

What color car is the least popular at this car dealership?
a)
Red
b)
White
c)
Blue
d)
Green
7.

The scatter plot shows the relationship between the number of chapters and the total number of pages for several books. Use the trend line to predict how many chapters would be in a book with 180 pages.
a)
12 chapters
b)
15 chapters
c)
18 chapters
d)
21 chapters
8.

Find the slope for the trend line using points (2,2) and (4,3)
a)
2
b)
1/2
c)
-2
d)
-1/2
9.

Which scatter plot shows a linear relationship between x and y?
a)
Graph A
b)
Graph B
c)
Graph C
d)
Graph D
10.

a)
440 turtles
b)
40 turtles
c)
150 turtles
d)
90 turtles
11.
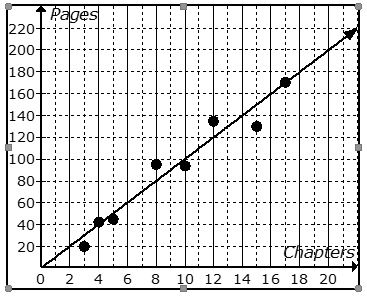
The scatter plot shows the relationship between the number of chapters and the total number of pages for several books. Use the trend line to predict how many pages would be in a book with 6 chapters.
a)
≅100 pages
b)
≅170 pages
c)
≅60 pages
d)
≅20 pages
12.

What type of association does this graph have?
a)
positive
b)
negative
c)
none
d)
all of the above
13.

What is the correlation?
a)
Negative correlation
b)
No correlation
c)
Positive correlation
d)
All of the above
14.

What type of association (correlation) does this graph have?
a)
positive
b)
negative
c)
none
d)
all of the above
15.

What type of association is there between the variables shown on this scatter plot?
a)
Strong, Positive Association
b)
Strong, Negative Association
c)
Weak, Positive Association
d)
No Association
16.

What type of association is there between the variables shown on this scatter plot?
a)
Strong, Negative Association
b)
Weak, Negative Association
c)
Strong, Positive Association
d)
No Association
17.

What type of association is there between the variables shown on this scatter plot?
a)
Weak, Positive Association
b)
Strong, Positive Association
c)
Weak, Negative Association
d)
No Association
18.

What type of association is there between the variables shown on this scatter plot?
a)
Weak, Positive Association
b)
Strong, Positive Association
c)
Weak, Negative Association
d)
No Association
19.

What type of association is there between the variables shown on this scatter plot?
a)
Strong, Positive Association
b)
Strong, Negative Association
c)
Weak, Positive Association
d)
No Association
20.

Describe the association for the graph.
a)
Linear and Positive
b)
Linear and Negative
c)
Non-Linear and Positive
d)
Non-Linear and Negative
e)
Non-Linear and No Association
21.
Which scatterplot does NOT suggest a linear relationship between x and y?
a)
b)
c)
d)
100 %

