
 Worksheets
5 Bivariate Data
Total questions: 70
Worksheet time: 1hrs 3mins
The outside temperature and the amount of layers you wear.


Which scatter plot shows a linear relationship between x and y?
Graph A
Graph B
Graph C
Graph D

is y= 1/2x +1. What does the x variable represent?

What would the correlation be between study time and test grades?
positive correlation
negative correlation
no correlation
cannot be determined
Bivariate data involves
one variable
two variables
three variables
four variables
_________ is a diagram that uses coordinates to display values for two variables for a set of data.
dot plot
scatter plot
histogram
stem and leaf plot
The correlation is positive if the y variable generally increases as the x variable increases.
True
False

In how many months did the City Central store sell more books than the Chatswood store?
1
2
3
4
A baseball coach graphs some data and finds the line of best fit. The equation for the line of best fit is y = 0.32x - 20.51, where x is the number of times at bat and y is the number of hits. How many hits should be expected from a player who is at bat 175 times?
35 hits
49 hits
609 hits
62 hits
A veterinarian student tracks the weight of a kitten, in ounces, from the age of 0 to 32 weeks. She graphs the data and determines the line of best fit is y = 4.03x + 3.27. What does the y-intercept represent in this situation?
The kitten weighs 3.27 ounces when it's born.
The kitten weighs 4.03 ounces when it's born.
The kitten gains 3.27 ounces a week.
The kitten gains 4.03 ounces a week.
A study compared the number of cars a person owns and that person’s average yearly salary. It was determined that the relationship between these two quantities was linear and the correlation was 0.37. Which conclusion can be made on the findings of this study?
There was a weak relationship.
There was a strong relationship.
There was no relationship.
Unpredictable.
What is another way to say regression line?
Histogram
Boxplot
Line of best fit
Scatterplot
Correlation coefficients are:
A point that does not fit the overall pattern.
A histogram.
A numerical measure of the direction and strength of a linear association.
A graphical display.
The relationship between a person’s age (a), and the amount of pets (p) they’ve had, is modeled by the equation p = 0.01a + 4.3. Based on the linear regression model, the correlation coefficient could be:
Between -1 and 0
Between 0 and 1
Equal to 0
Equal to -1

The line of best fit for this data is y=5.2x −75 . Interpret the y-intercept
When there are zero visitors, we predict negative 75 degrees that day on the beach.
When the temperate is zero, we predict negative 75 visitors on the beach.
When the temperate is zero, there will be negative 75 visitors on the beach.
There is no y-intercept
A veterinarian student tracks the weight of a kitten, in ounces, from the age of 0 to 32 weeks. She graphs the data and determines the line of best fit is y = 4.03x + 3.27. What does the slope represent in this situation?
For every week the kitten ages, we predict the kittens weight to increase by 4.03 times as much
For every week the kitten ages, the kittens weight to increase by 4.03 ounces
For every ounce the kitten weighs, we predict the kittens age to increase by 4.03 weeks
The kitten gains 4.03 ounces
A graph that shows the relationship between two data sets where the two sets of data are graphed as ordered pairs.
Scatter Plot
Bivariate Data
Joint Frequency
Graph
As X increases, Y increases.
Line
Negative Correlation
No Relation
Positive Correlation
As X increases, Y decreases.
Positive Correlation
Negative Correlation
No Relation
A line drawn on a scatter plot that is close to most of the data points.
Best fitting line
Best Linear Line
Line of best fit
Data for two variables.
Brivariate Data
Brovariate Data
Bivariate Data
Divariate Data
Displays two categories of data collected from the same source.
T-table
Two-way table
Two Way Chart
Table Table
Data was collected on the weight of a male laboratory rat for the first 25 weeks after its birth. The linear regression equation is y= 40x+100, where x is number of weeks and y is weight in grams. What does the y-intercept mean in context of the problem?
The predicted weight of the rat in year 0.
The predicted weight of the rat at birth.
The current weight of the rat.
The average increase in the rat's weight.

The linear regression equation is y = 61.93x - 1.79. According to the model, the slope can be interpreted as:
After 0 hours of driving, they went 61.93 miles.
They drove at a speed of 61.93 miles per hour.
They drove 61.93 miles total.
They drove 61.93 hours total.
The x-values of a function can also be called:
the dependent values
the maximum minus the minimum
the domain
the range


If x is temperature and y is coffee sales, use the following formula to determine the coffee sales on a 34° day.
y = -60x+6443
$4403
$4673
$8483
$6443

Write the equation for the linear regression shown.
y=ax+b
y=0.6x+0.1
y=0.72x+r
y=0.1x+0.6
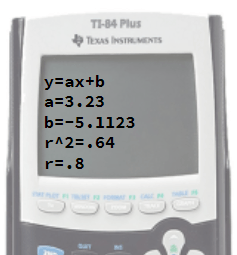
Write the equation for the linear regression shown.
y=−5.11x+3.23
r=0.8
y=3.23x − 5.11
y=0.64x+0.8

What would be the correlation between absences and test grades?
positive
negative
none
cannot be determined

Estimate the correlation coefficient for this scatterplot.
r = 1.2
r = 0.89
r = 0
r = -0.89
The equation y = -2x + 7 models the amount of gas remaining in a lawnmower after x hours of use since it was filled. What is the meaning of the slope?
For each hour of mowing, the mower is predicted to use 2 gallons.
the predicted amount of gas the lawnmower can hold is 2 gallons
For every two hours of mowing, the mower is predicted to use 7 gallons.
The predicted amount of gas remaining after 1 hour is 2 gallons.
What is the y-intercept in the following equation: y= -5 - 4x?
-4
-4x
5
-5
What is the slope in the following equation: y= 6 - 2/3x?
2/3
6
-6
-2/3
Rich is a member of a gym. He pays a monthly fee plus a per-visit fee. The equation below represents the monthly amount Rich pays for his membership to the gym per month for x visits.
y= 10 + 3x
What does the y-intercept of the graph of this equation represent?
The monthly fee
How much Rich pays per visit
The number of times Rich goes to the gym
The total cost at the end of the month

The speed (in miles per hour) of 8 vehicles and their braking distances (in feet) when stopping on a dry surface are shown in the table. What is the value of n?
8
18
20
225

What is the critical value when n = 10 at 0.05 level of significance?
0.602
0.632
0.735
0.765

Test the significance of r=0.980 when n = 10 at 0.05
Significant
Not significant
Cannot be determined
Sometimes significant
Using level of significance at 5% means that ....
the result is correct
the result is 5% correct
the result is 95% correct
there is a need for another test

Find the value r in the given set of data
0.899
0.915
0.980
0.987
In the equation y = -3.516x + 68, what is the value of slope?
y
x
68
-3.516
Write the equation of line of best fit ( y = ax + b ) with the given: a = 2.35 ; b = 95
y = 95 - 2.35x
y = 95x - 2.35
y = 2.35x + 95
y = 2.35x - 95
When the computed value is greater than the critical value,
the test is significant
the test is not significant
the test cannot be determined
do the test again
Test the significance at 1%:
critical value = 0.765 versus computed value = 0.259
significant
not significant
cannot be determined
not enough information

What is the critical value when n = 15 at 0.01 level of significance?
.532
.514
.661
.641
In the equation of the line of best fit y = -4.262x + 97, what is the value of the slope?
4.262
-4.262
97
-97
Given the computed value of the following: r = 0.259 ; a = 0.25 ; b = 61. Write the equation of best fit.
y = 0.259x + 61
y = 61x + 0.259
y = 0.25 + 61x
y = 0.25x + 61
Domain is ....
all the values of x
all the values of y
all the values of m
all the values of b

The given data has a best-fit equation of y = 3.889x - 63. What is the braking distance when the speed is 55?
114
138
150
155


How many male students were surveyed?
30
29
50
59


How many females were surveyed?
45
73
16
12

