
Font size
 Worksheets
Correlation and Graph Interpretation
Total questions: 18
Worksheet time: 46mins

A survey was conducted to determine the state of the physical and psychological health of high school students.
Some of the survey questions related to student stress levels and student absences due to illness. The data on these variables are displayed in the image.
Which of the following conclusions are appropriate to draw based on the figure above? (Choose all that apply.)
stress leads to illness
as stress levels increase, the number of absences tends to increase.
many student absences are due to stress.
there is an indirect relationship between stress and illness.
there is a positive correlation between stress level and number of absences.

Estimate the correlation coefficient for this scatterplot.
A) r = 1.2
B) r = 0.89
C)r = 0
D) r = -0.89

Describe the relationship between the variables.
A) Weak negative correlation
B) Moderate negative correlation
C) Moderate positive correlation
D) Strong negative correlation
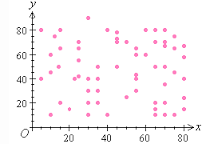
What type of correlation does this graph show?
A) Positive
B) negative
C) none
D) all of the above
As x increases, y decreases.
A) no correlation
B) negative correlation
C) correlation coefficient
D) positive correlation

The scatter plot below shows the number of books read by students in Ms. Mcguire's English class and their final grades. Which statement represents the best description about the line of best fit?
A) The more books students read, the lower their English grade.
B) The more books students read, the higher their English grade.
C) The fewer books students read, the higher their English grade.
D) No relationship exists between the number of books students read and their English grades.

What is the correct interpretation of the scatterplot about the age of a person and the number of pets owned?
The older a person is, the more pets they own.
The younger a person is, the more pets they own
There is no correlation between a person's age and how many pets they own
The older a person is, they own fewer pets

What is the interpretation between a person's age and how fast they walk?
The older a person is, the slower they walk
The older a person is, the faster they walk
There is no correlation between the age of a person and how fast they walk
People just stop walking at the age of 65

Describe where the outlier is located in the scatterplot?
(13, 24.5)
(12.5, 25)
(12.2, 18)
Between 11 and 12

Estimate the correlation coefficient
r = 1
r = -1
r ≈ -0.8
r ≈ 0.8
r ≈ -0.5
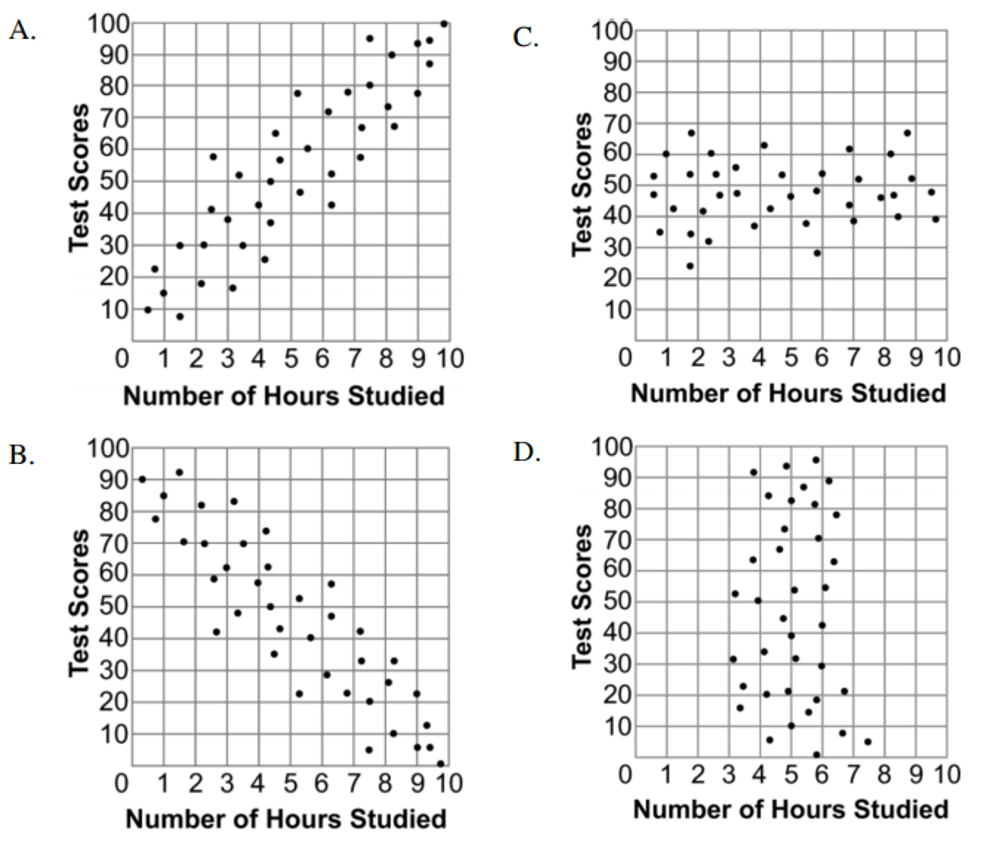
Which scatter plot diagram shows the strongest positive correlation?
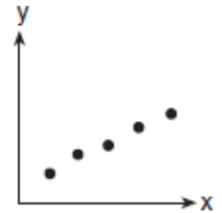
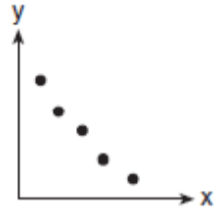
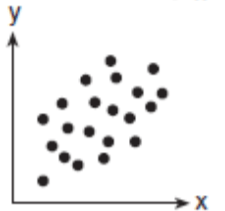
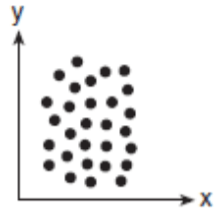
Which graph represents data that has a correlation coefficient close to -1?
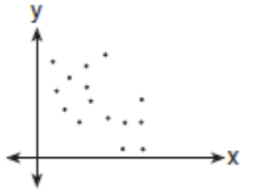
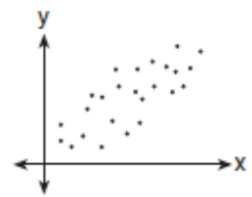
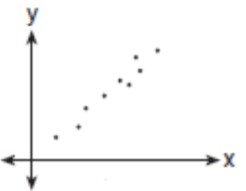
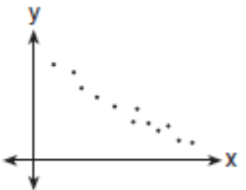

Estimate the correlation coefficient.
r is close to zero
r is close to -1
r is close to 1
r is close to -1.5
r is close to 1.5


What is the equation of the line of best fit?
y = -25x + 170
y = -5/8x + 170
y = 25x + 170
y = 5/8x + 170


