
Font size
 Worksheets
Continuous and Discontinuous variation
Total questions: 15
Worksheet time: 30mins
What is the scientific word that refers to the differences within a species?
variation
characteristics
features
inheritance
What causes variation?
inherited factors only
environmental factors only
inherited and environmental factors
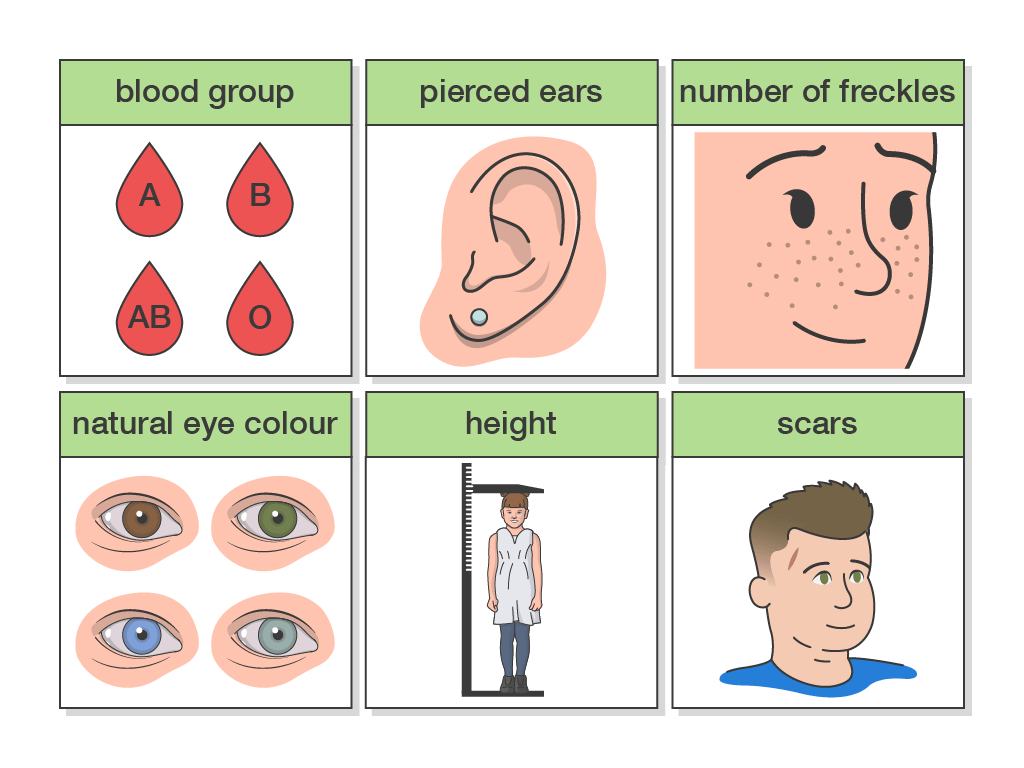
Which two characteristics show variation as a result of inherited factors only?
blood group
pierced ears
number of freckles
natural eye colour
height
Which two characteristics show variation as a result of environmental factors only?
blood group
pierced ears
Scar
natural eye colour
height
Which two characteristics show variation as a result of a combination of both inherited and environmental factors?
blood group
pierced ears
number of freckles
natural eye colour
height
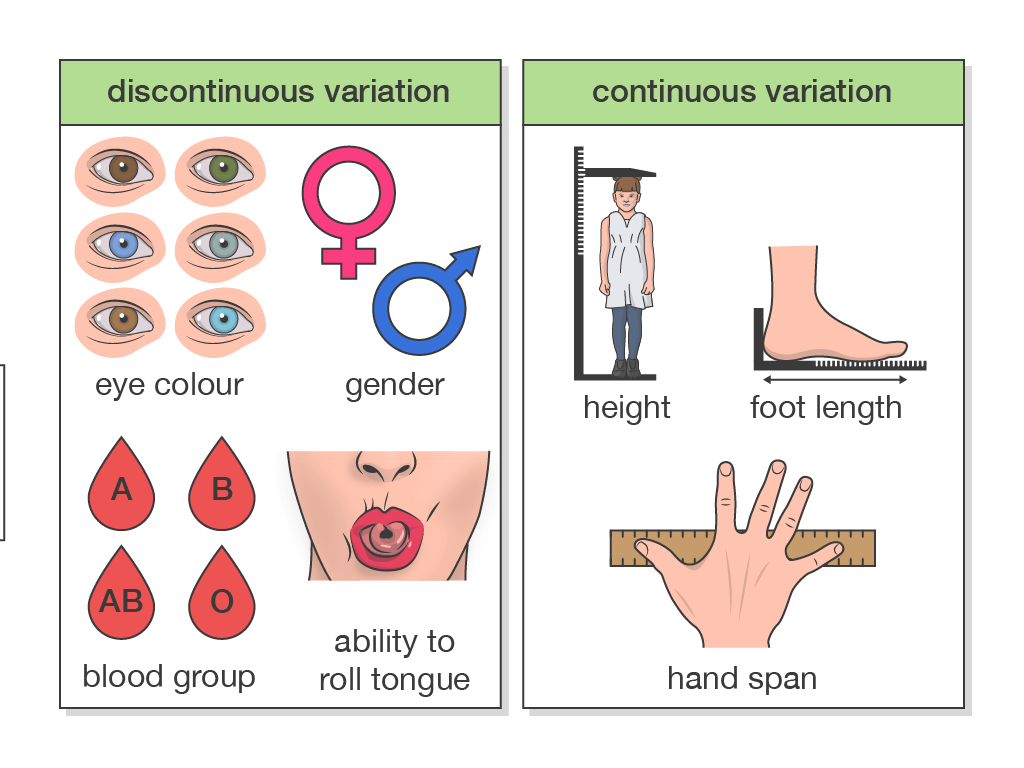
For which type of variation can a measurement have any numerical value?
continuous variation
discontinuous variation
For which type of variation are differences grouped into categories?
continuous variation
discontinuous variation
If you were to investigate the height of everyone in your class, what type of data would you be gathering?
continuous variation
discontinuous variation
If you were to investigate the eye colour of everyone in your class, what type of data would you be gathering?
continuous variation
discontinuous variation
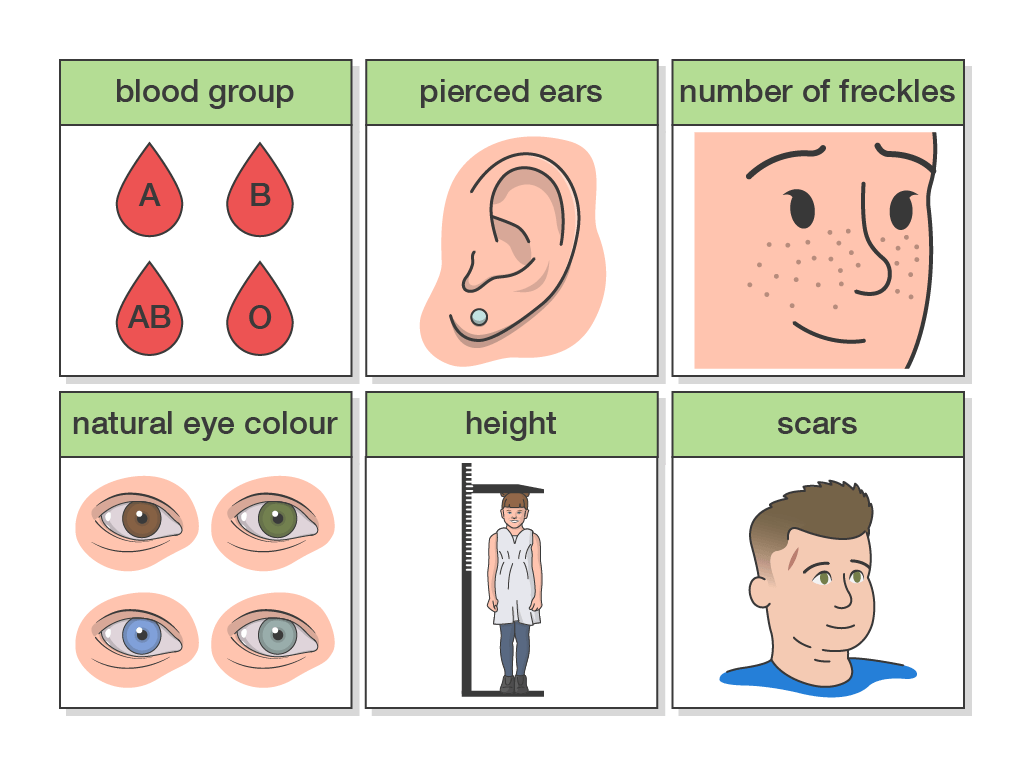
Which three features show discontinuous variation?
blood group
height
foot length
eye colour
gender
Which Two features show continuous variation?
blood group
height
foot length
eye colour
gender
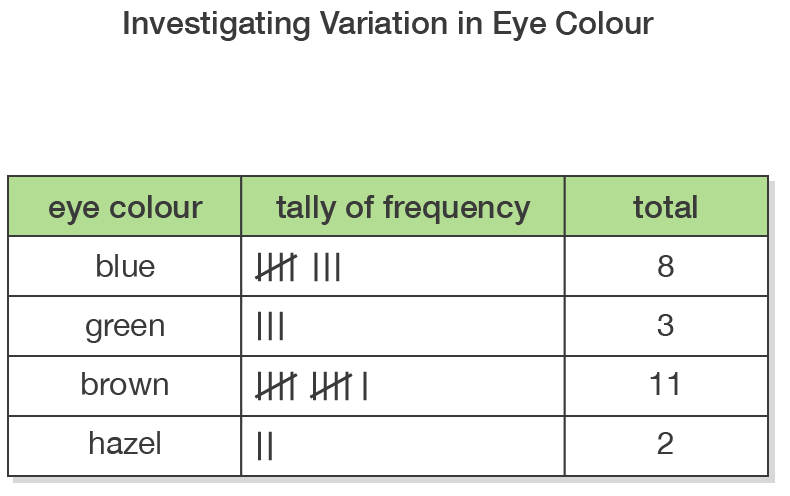
How should the data in the table shown be presented?
scatter graph
bar chart
histogram
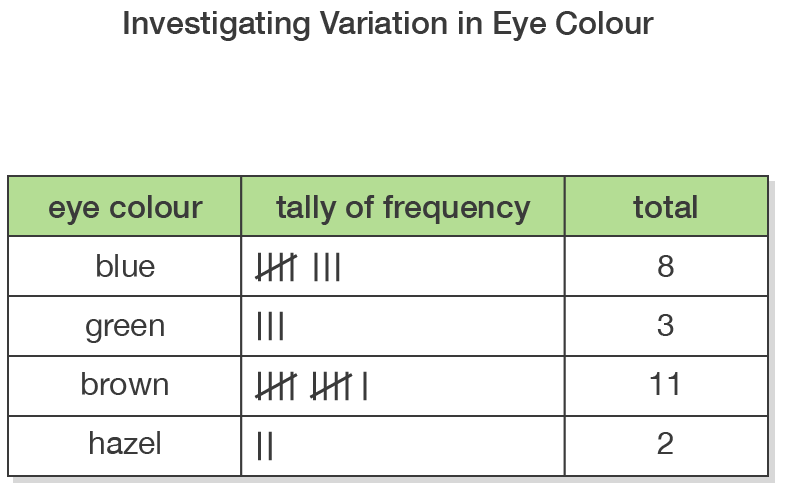
Why should the data in the table shown be presented in a bar chart?
The data is numerical.
The data is in categories
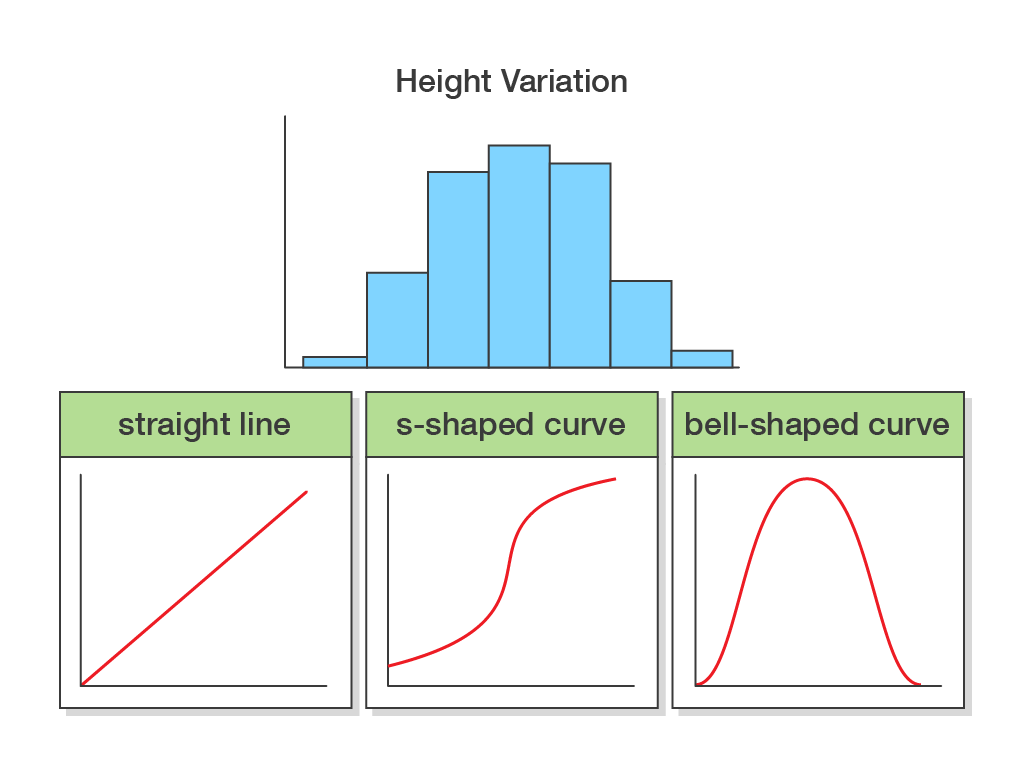
Features with continuous variation have a normal distribution curve, which is shown by the bars on the graph. What shape do the bars form when there is normal distribution?
straight line
s-shaped curve
bell-shaped curve
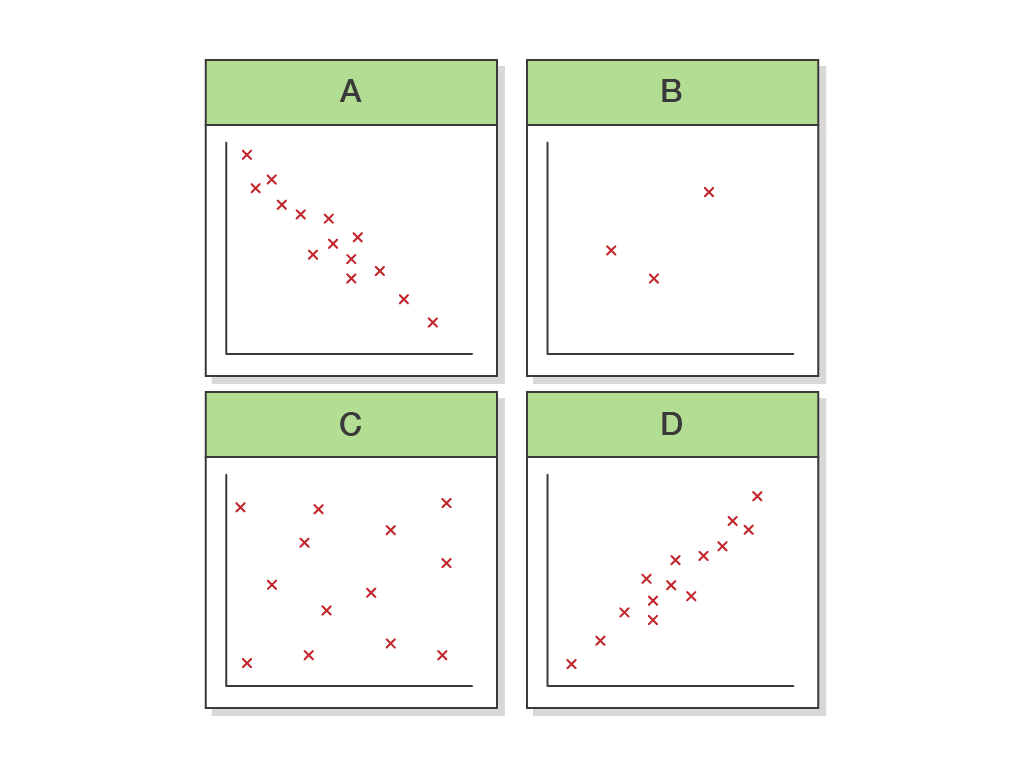
Which two scattergraphs show a correlation (relationship) between the two plotted variables?
scattergraph A
scattergraph B
scattergraph C
scattergraph D

