
 Worksheets
Motion Review
Total questions: 14
Worksheet time: 12mins

Describe the motion of the car on this graph.
Accelerating
Stopped
Constant speed
Coming back to start

Describe the motion at position A and B.
The object is moving faster along A than along B.
The object is moving faster along B than long A.
The object is moving the same speed along A and B.
The object is accelerating along A and B
Choose the graph that matches the following scenario:
A student walked to his locker, stopped for awhile and then continued on in the same direction at a faster pace to class.


Choose the graph that matches the following scenario:
A student ran to the cafeteria, then stopped and looked around for his lunch kit, and then ran back to the class to get it.
Which of the following calculations correctly show the work for calculating the average speed along B. Check all that apply.
v=td=100100=1 sm
v=td=2060=3 sm
v=slope=runrise=↑20↑60≈0.33 sm
v=slope=x2−x1y2−y1=100−80100−40=3 sm
v=td=6020≈0.33 s2m

According to the speed time graph, what is happening from point B to C?
The object is traveling at a constant speed.
The object is moving back towards start.
The object is decelerating (decreasing its speed).
The object is increasing its speed.
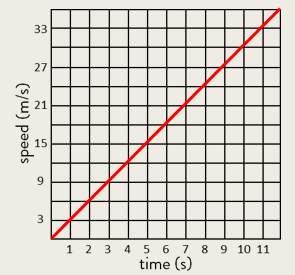
Describe the object's motion.
Constant speed
accelerating (increasing speed)
decelerating (slowing down constantly)
stopped


A distance-time graph is displayed. When is the object's acceleration zero?
0-20 seconds
20-30 seconds
20-50 seconds
all of the above


What is this graph showing?
zero acceleration
Constant speeding
decreasing speed
increasing speed

Which part of the speed-time graph is the object traveling the fastest?
OA
AB
BC
DE
Which formula(s) could be used to calculate the acceleration along DE? CHECK ALL THAT APPLY.
v=td
slope = runrise
a=ΔtΔv
E=mc2

Which of the following show the correct calculation of the acceleration of the object along segment D?
v=td=20−25=−1.25 sm
a=tΔv=5025=0.5 s2m
a=tΔv=20−25=−0.8 s2m
a=tΔv=2520=1.25 s2m
a=tΔv=20−25=−1.25 s2m

