
 Worksheets
Math - Week 8 Review - Data
Total questions: 16
Worksheet time: 26mins
Name
Class
Date
1.

Look at the Bar Graph "Student Grades". Which grade did the smallest number of students get?
a)
A
b)
B
c)
C
d)
D
2.

Which day had more minutes of homework?
a)
Wednesday
b)
Thursday
c)
Friday
d)
Ms. Jones
3.

How many students like vanilla and chocolate?
a)
8
b)
32
c)
30
d)
28
4.

How many students voted for their favorite sport?
a)
38
b)
17
c)
40
d)
50
5.
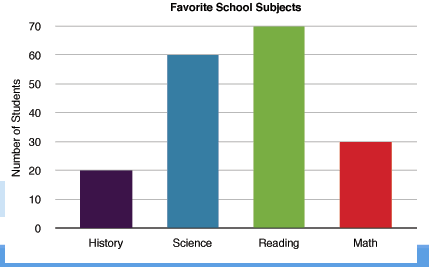
Which subject has 10 fewer votes than Reading?
a)
History
b)
Science
c)
Math
d)
Spelling
6.

How many hours did James spend revising on Monday?
a)
2
b)
1
c)
4
d)
6
7.
How many hours did James spend revising on Wednesday?
a)
1.5
b)
3
c)
2
d)
4
8.
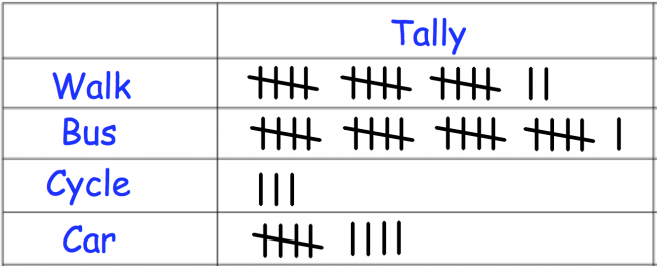
How many people walk to school?
a)
17
b)
15
c)
21
d)
11
9.

For how many weeks did it rain 5 days?
a)
1
b)
5
c)
6
d)
4
10.

How many more boys than girls have shoes that are 22 centimeters long?
a)
16
b)
2
c)
9
d)
4
11.

When was the greatest amount of shoppers at the store?
a)
10am
b)
1pm
c)
6pm
d)
2pm
12.

Did the temperature increase or decrease between day 1 and day 2?
a)
increase
b)
decrease
13.

What is the general trend of this line graph?
a)
The more you mow, the less money you make.
b)
You make the same amount of money regardless of how long you mow.
c)
The more you mow, the more money you make.
d)
Mowing is dangerous.
14.

What is the name of this type of graph?
a)
line plot
b)
line graph
c)
bar graph
d)
frequency table
15.

What label is along the y-axis in this graph?
a)
Copyright 2007
b)
Lines
c)
Age in Years
d)
Number of Teens
16.

What is the title of this graph?
a)
Cookie Sales
b)
Number of boxes
c)
day
d)
Cookie sales and number of boxes
100 %

