
 Worksheets
Bar and Pictographs
Total questions: 10
Worksheet time: 21mins
Name
Class
Date
1.

What type of graph is shown?
a)
bar graph
b)
pictograph
c)
line plot
d)
tally chart
2.

What type of graph is shows?
a)
bar graph
b)
pictograph
c)
line plot
d)
tally chart
3.

How many students are in the class?
a)
23
b)
22
c)
25
d)
6
4.

Which color had the most votes?
a)
red
b)
blue
c)
green
d)
pink
5.

Which color had an odd number of votes?
a)
green
b)
blue
c)
pink
d)
red
6.

a)
The store sells 3 more computers on day 3 than on day 1.
b)
The store sells 9 more computers on day 2 than on day 4.
c)
The store sells a total of 10 computers on day 3 and 4 combined.
d)
The store sells a total of 23 computers on all 4 days combined.
7.

a)
b)
c)
d)
8.
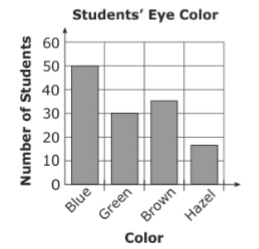
Miss Lee's science class collected data on the color of 3rd grade student's eyes. The students created a bar graph with this information. How many more students had blue eyes than green eyes?
a)
80
b)
50
c)
30
d)
20
9.

How many students like oranges and apples?
a)
7
b)
45
c)
70
d)
20
10.

How many total votes were collected?
a)
5
b)
10
c)
15
d)
20
100 %

