
 Worksheets
Bivariate Data
Total questions: 22
Worksheet time: 42mins
Name
Class
Date
1.

a)
A
b)
B
c)
C
d)
D
2.

What relationship is shown in the scatter plot?
a)
As the cost goes down, the number sold goes down.
b)
As the cost goes up, the number sold goes down.
c)
As the cost goes down, the number sold remains the same.
d)
There is not relationship between cost and the number sold.
3.
A keyboarding instructor at a community college collected data comparing a student's age and their typing speed. The equation for the line of best fit is given as:
y = -1.4x + 117.8
If you are 25 years of age (x), what is your typing speed (y)?
y = -1.4x + 117.8
If you are 25 years of age (x), what is your typing speed (y)?
a)
153 words per minute
b)
83 words per minute
c)
63 words per minute
d)
102 words per minute
4.
Which is NOT an example of categorical data?
a)
gender
b)
hair color
c)
academic level
d)
amount of money one makes
5.
The number of times a value occurs
a)
Two-way table
b)
Scatter Plot
c)
Frequency
d)
Line of Best Fit
6.
Data points that are far away from most other points
a)
Cluster
b)
Outlier
c)
Correlation
d)
Scatter Plot
7.
A baseball coach graphs some data and finds the line of best fit. The equation for the line of best fit is
y = 0.32x - 20.51, where x is the number of times at bat and y is the number of hits.
How many hits should be expected from a player who is at bat 175 times?
y = 0.32x - 20.51, where x is the number of times at bat and y is the number of hits.
How many hits should be expected from a player who is at bat 175 times?
a)
35 hits
b)
49 hits
c)
609 hits
d)
62 hits
8.
A veterinarian tracks the weight of a kitten, from the age of 0 to 32 weeks. She graphs the data and the line of best fit is y = 4.03x + 3.27. How much should she expect a kitten that is 18 weeks old to weigh?
a)
3.67 ounces
b)
75.81 ounces
c)
21.27 ounces
d)
72.54 ounces
9.

a)
20
b)
55
c)
35
d)
85
10.
If a line of best fit models the data very well, what would you expect to see in a graph of the data and the line?
a)
The line connects a lot of the points.
b)
The line is underneath all the points.
c)
The line is non-linear.
d)
The line is close to all the points.
11.

What type of correlation is shown in the scatter plot?
a)
Positive Linear Correlation
b)
Negative Linear Correlation
c)
Non-Linear Correlation
d)
No Correlation
12.
What type of correlation (association)?
The outside temperature and the amount of layers you wear.
The outside temperature and the amount of layers you wear.
a)
Positive correlation
b)
Negative correlation
c)
No correlation
13.

What is the type of association?
a)
Negative
b)
no association
c)
positive
14.
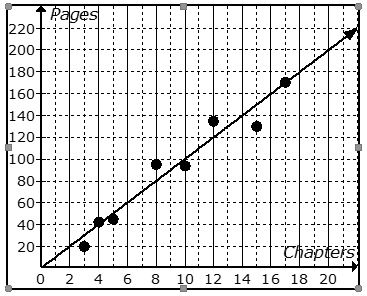
The scatter plot shows the relationship between the number of chapters and the total number of pages for several books. Use the trend line to predict how many chapters would be in a book with 180 pages.
a)
12 chapters
b)
15 chapters
c)
18 chapters
d)
21 chapters
15.

What is the correlation between length of running start and distance of jump?
a)
positive: the further you run the further you jump
b)
negative: the less you run the less distance of your jump
c)
positive: the further your running start the less your distance
16.

What type of association does this graph have?
a)
positive
b)
negative
c)
none
d)
all of the above
17.

Which scatter plot shows a linear relationship between x and y?
a)
Graph A
b)
Graph B
c)
Graph C
d)
Graph D
18.
In a scatterplot, a cluster...
a)
...is something we didn't learn in 8th grade
b)
...is a point on the origin
c)
...is a point that is far outside the main cluster of points/ordered pairs
d)
...is a group of points that are close together
19.

Which of the following lines represents the line of best fit for the scatter plot?
a)
A
b)
B
c)
C
d)
D
20.
What is a line of best fit used for?
a)
To make predictions
b)
To make the graph look pretty
c)
To connect the points
d)
To make it look like you know what you are doing
21.

If the debate team plans to practice for 6 hours, how many debates should they win?
a)
20
b)
16
c)
24
d)
28
22.
What is another way to say regression line?
a)
Histogram
b)
Boxplot
c)
Line of best fit
d)
Scatterplot
100 %

