
 Worksheets
MAP 3.1 One and Two variable Data
Total questions: 12
Worksheet time: 12mins
Which can't be used when dealing with 1 variable data?
Pictograph
Histogram
Scatter Plot
Bar Graph
Circle Graph

What type of graph is this?
Bar Graph
Histogram
Pictograph
Scatter Plot
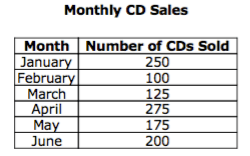
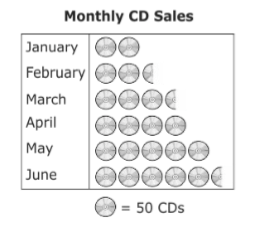
In the chart , a music store listed the number of CDs sold each month for 6 months. Which graph correctly represents the information in the chart?
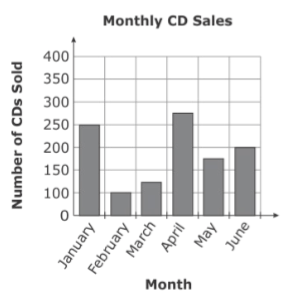
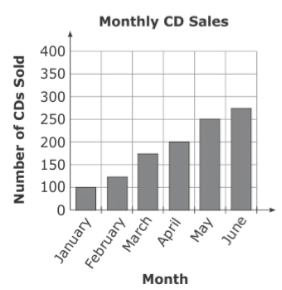
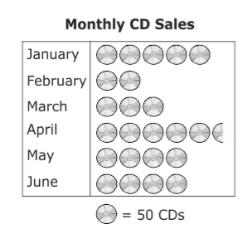
Which can't be used when dealing with 2 variable data?
Ordered Pairs
Points
Scatter Plot
2 Column Dat
Histogram

What could be the relationship statement for this scatter plot?
Ice cream sales depend on temperature.
As the outside temperature increases, the ice cream sales increase.
As the outside temperature decreases, the ice cream sales increase.
There is no relationship between sales and temperature.
What describes how strong and the type of relationship between two data sets?
Compilation
Correction
Cooperation
Correlation

Describe the type of correlation in this scatter plot.
Positive
Negative
No correlation
Very strong
Which of the following could be correlated?
age versus race
number of siblings versus types of pets
number of family members vs types of vacation
years of experience versus amount of money saved


The scatter plot below shows the number of books read by students in Mrs. Hall’s English class and their final grades. Which statement represents the best description about the line of best fit?
A) The more books students read, the lower their English grade.
B) The more books students read, the higher their English grade.
C) The fewer books students read, the higher their English grade.
D) No relationship exists between the number of books students read and their English grades.


