Worksheets
Linear Equations, Bar Graphs, and Circle Graphs Min Quiz
Total questions: 12
Worksheet time: 12mins

Students in a math class were asked which hand they preferred to use for writing. The bar graph
shows the results.
Of students that had a preference, what percent chose
the left hand?
75%
25%
24%
6%

According to the following circle graph, what is the least favorite beverage?
Coffee
Cola
Water
Tea

How many people took the survey in the following bar graph?
10
6
40
20

Which teacher probably assigns more homework?
Ms. Smith
Mrs. Williams
Ms. Jones
Mrs. Brown

On Thursday, how much longer did it take to finish Ms. Jones homework that Mrs. Williams?
2 Minutes
10 Minutes
30 Minutes
4 Minutes

The 7th grade class participated in the following fitness challenges. If there are 250 students total, how many participated in weight lifting?
20
8
80

If there are 180 girls in athletics, how many girls play soccer and basketball?
54
81
45

On a two-week job, a repairman works a total of 70 hours. he charges $75 plus $40 per hour. Which equation shows his rate of pay?
y = 40x +75
y = 75x + 40
y = 45x + 70
y = x
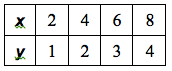
y = 5x + 8