wayground logo

Free Printable Worksheets

NEW

Font size

S
M
L
XL
Worksheets

Dot Plot and Frequency Table

Total questions: 67

Worksheet time: 4hrs 22mins
Name
Class
Date
1.
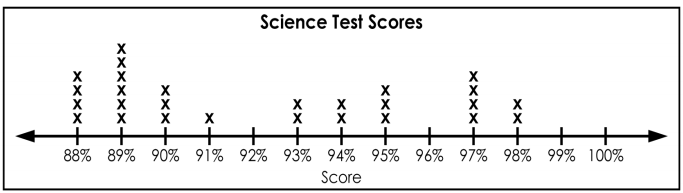
How many more students scored a 98 than scored a 88?
a)
4
b)
2
c)
6
d)
35
2.
How many students scored 93% or less?
a)
6
b)
16
c)
14
d)
13
3.
How many students spent 7 hours doing homework that week?
a)
1
b)
3
c)
5
d)
6
4.
How many total students are in the science class?
a)
13
b)
6
c)
27
d)
25
5.
Each dot represents 1 day. How many days were recorded?
a)
9
b)
21
c)
20
d)
105
6.
What is the difference between the highest score and the lowest score on the test?
a)
15
b)
100
c)
6
d)
10
7.
How many students scored between 95 and 100?
a)
6
b)
6
c)
9
d)
14
8.
How many students received a score of 94%? 
a)
94
b)
4
c)
1
d)
2
9.
How many students spent 7 hours doing homework that week?
a)
1
b)
3
c)
5
d)
6
10.
How many total students are in the science class?
a)
13
b)
6
c)
27
d)
25
11.
What is the highest score in the class?
a)
88%
b)
100%
c)
13
d)
98%
12.
How many people have two or less books in their desk?
a)
4
b)
5
c)
6
d)
7
13.

how many people voted in this dot plot

a)

4

b)

9

c)

3

d)

not here

14.
How many students received a score of 94%? 
a)
94
b)
4
c)
1
d)
2
15.
What is the highest score in the class?
a)
88%
b)
100%
c)
13
d)
98%
16.
How many students received a score in the 90s?
a)
6
b)
2
c)
91%
d)
17
17.
How many total students are in the science class?
a)
13
b)
6
c)
27
d)
25
18.
How many more students scored a 98 than scored a 88?
a)
4
b)
2
c)
6
d)
35
19.
How many students received a score in the 80's?
a)
2
b)
10
c)
14
d)
27
20.

Which three ages combined have the highest number of students

a)

6.7.8

b)

8,9,10

c)

10,11,12

d)

4,5,6

21.

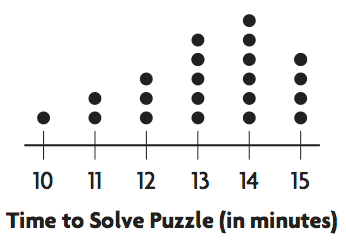
What number represents the time that the greatest number of students solved the puzzle?

a)

12

b)

13

c)

14

d)

15

22.

How many more students solved the puzzle in 14 or more minutes than solved the puzzle in 11 or less minutes?

a)

10

b)

7

c)

8

d)

3

23.

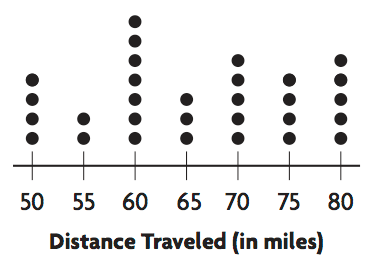
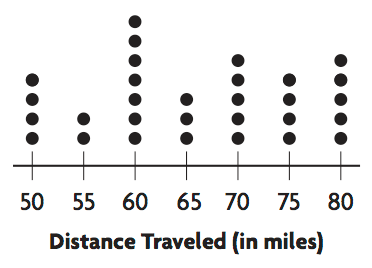
Jose travels several miles each day for his job. The dot plot shows the distances he traveled for one month. How many days did Jose travel 50, 55, or 60 miles?

a)

4

b)

2

c)

7

d)

13

24.

How many more days did Jose travel 70 miles than 65 miles?

a)

5

b)

2

c)

1

d)

3

25.

How many more days did Jose travel 60 or less miles than he traveled 75 or more miles?

a)

4

b)

7

c)

3

d)

9

26.
Each dot represents 1 day. How many days were recorded?
a)
9
b)
21
c)
20
d)
105
27.
How many trouts weighed MORE THAN 450 grams?
a)
8
b)
14
c)
11
d)
10
28.
How many students received a score in the 90s?
a)
6
b)
2
c)
91%
d)
17
29.
How many students have 12 Brothers and Sisters? 
a)
4 students
b)
7 students
c)
0 students
d)
1 student
30.
How many students have 0 Brothers and Sisters? 
a)
6 students
b)
0 students
c)
12 students
d)
10 students
31.
What was the day with the least amount of cars sold? 
a)
Monday
b)
Tuesday
c)
Wednesday
d)
Thursday
32.
How many students had more than 6 candy bars?
a)
5
b)
2
c)
3
d)
1
33.
How many students received a score of 94%? 
a)
94
b)
4
c)
1
d)
2
34.
How many total students are in the science class?
a)
13
b)
6
c)
27
d)
25
35.
The peak of the data is found at which number?
a)
0
b)
10
c)
3 & 5
d)
6 & 7
36.

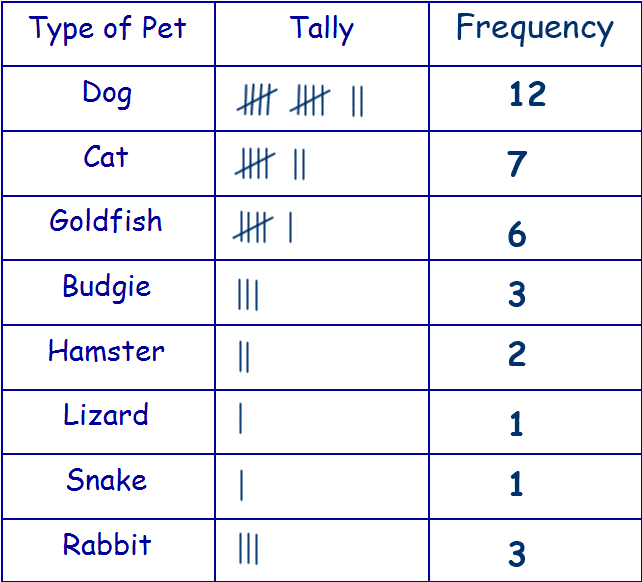
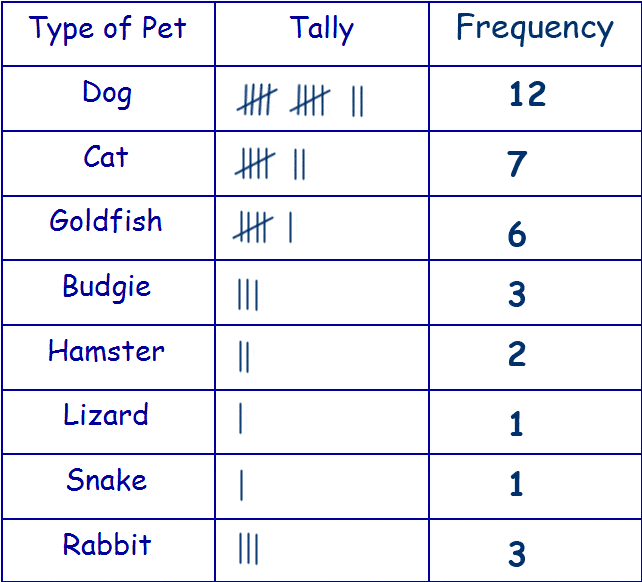
Which is the most popular pet?

a)

Dog

b)

Cat

c)

Hamster

d)

Rabbit

37.

Which are the least popular pets?

a)

Cats and dogs

b)

Goldfish and budgie

c)

Lizard and snake

d)

Hamster and rabbit

38.

Which pet was chosen by 6 people?

a)

Cat

b)

Goldfish

c)

Hamster

d)

Snake

39.

Which pet was chosen by 2 people?

a)

Dog

b)

Cat

c)

Lizard

d)

Hamster

40.

Which pets were chosen by 3 people?

a)

Cat and dog

b)

Budgie and rabbit

c)

Goldfish and hamster

d)

Lizard and snake

41.

How many people like dogs and cats?

a)

12 + 7 = 19

b)

7 + 6 = 13

c)

12 + 6 = 18

d)

6 + 3 = 9

42.

How many people like goldfish and rabbits?

a)

6 + 1 = 7

b)

3 + 1 = 4

c)

6 + 2 = 8

d)

6 + 3 = 9

43.

How many more people liked goldfish than snakes?

a)

7 - 1 = 6

b)

6 - 3 = 3

c)

6 - 1 = 5

d)

6 - 2 = 4

44.

How many more people liked cats than rabbits?

a)

7 - 2 = 5

b)

7 - 3 = 4

c)

6 - 3 = 3

d)

6 - 1 = 5

45.

How many people voted altogether?

12 + 7 + 6 + 3 + 2 + 1 + 1 + 3 =

a)

35

b)

34

c)

36

d)

33

46.
What color car is the least popular at this car dealership?
a)
Red
b)
White
c)
Blue
d)
Green
47.

How many boys have shoes that are 18 centimeters long?

a)

6

b)

10

c)

2

d)

5

48.
How many children participated in the survey?
a)
34
b)
30
c)
32
d)
6
49.
a)
7
b)
0
c)
3
d)
5
50.
a)
11
b)
1
c)
2
d)
9
51.

How many students voted for fish or cat?

a)

10

b)

6

c)

4

d)

2

52.

How many fewer students bird than fish?

a)

2

b)

6

c)

4

d)

8

53.

How many girls have shoes that are 18 centimeters long?

a)

6

b)

10

c)

4

d)

5

54.

How many girls have shoes that are 22 centimeters long?

a)

6

b)

7

c)

5

55.

How many boys have shoes that are 20 centimeters long?

a)

8

b)

7

c)

9

56.
What color car is the least popular at this car dealership?
a)
Red
b)
White
c)
Blue
d)
Green
57.
How many sophomores like burritos and pizza?
a)
6
b)
5
c)
11
d)
50
58.
How many more Freshman ate pizza than Juniors?
a)
5
b)
1
c)
10
d)
6
59.
What food did the Sophmores eat the least of?
a)
Burrito
b)
Pizza
60.
How many Seniors ate burritos or pizza?
a)
10
b)
5
c)
15
d)
10
61.
How many more blue cars are there than green SUVs?
a)
35
b)
45
c)
25
d)
30
62.
The frequency table shows the colors that fifth graders preferred for their school shirts.
Based on the data in the table, how many students preferred the three colors that had the highest frequencies?
a)
38
b)
91
c)
147
d)
105
63.

How many boys have shoes that are 18 centimeters long?

a)

6

b)

10

c)

2

d)

5

64.

How many more boys than girls have shoes that are 22 centimeters long?

a)

16

b)

2

c)

9

d)

4

65.

How many total students were surveyed?

a)

64

b)

60

c)

24

d)

54

66.

How many total shoes were 18 centimeters and 20 centimeters long?

a)

20

b)

18

c)

27

d)

10

67.

How many total girls were surveyed?

a)

29

b)

35

c)

30

d)

20