
Font size
S
M
L
XL
 Worksheets
Proportional and Non-proportional Relationships
Total questions: 17
Worksheet time: 4hrs 15mins
Name
Class
Date
1.

Which graph is proportional?
a)
A
b)
B
c)
C and D
d)
All of the graphs are proportional
2.

Does the equation show a proportional relationship?
a)
Yes
b)
No
3.
Which best describes the equation?
y = 75x
y = 75x
a)
Proportional
b)
Nonproportional
4.

Why does this graph show a non-proportional relationship?
a)
Because it is proportional
b)
It goes through the origin
c)
It does not go through the origin
d)
It is a straight line
5.
Does the equation show a proportional relationship?
a)
Yes
b)
No
6.
Which best describes the equation?
y = 75x
y = 75x
a)
Proportional
b)
Nonproportional
7.
Which of the equations below is proportional?
a)
y = 6x
b)
y = 3x + 2
c)
y = 2x + 4
d)
y = -2x -1
8.
Select all graphs that represent proportional relationships.
a)
b)
9.
Select all graphs that represent a proportional relationship.
a)
b)
10.
Select all equations that represent a proportional relationship.
a)
b)
11.

Is the graph proportional?
a)
Yes
b)
No
12.

Is the graph proportional?
a)
Yes
b)
No
13.

These two lines are graphs of nonproportional relationships. What makes them nonproportional?
a)
They are not straight
b)
They are not linear
c)
They do not go through the origin
d)
They do not show a constant rate of change
14.

Identify whether the graph represents a proportional or non-proportional relationship.
a)
Proportional Relationship
b)
Non-Proportional Relationship
15.

Why does this graph show a non-proportional relationship?
a)
Because it is proportional
b)
It goes through the origin
c)
It does not go through the origin
d)
It is a straight line
16.
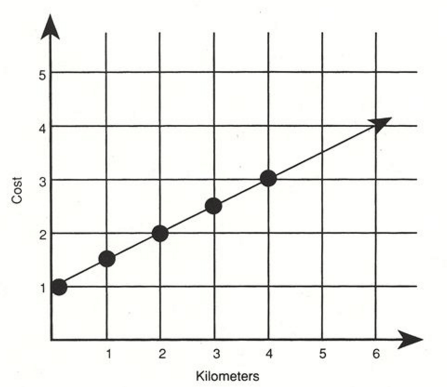
Is the graph proportional or non proportional?
a)
proportional
b)
non proportional
17.

Which graph is non-proportional?
a)
A
b)
B
c)
C
d)
D
Reset

