
 Worksheets
Alg I Semester 2 Review
Total questions: 78
Worksheet time: 4hrs 6mins
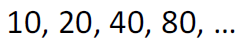
What are the next 3 terms in the following geometric sequence:
512, 256, 128, ___, ___, ___, ...
1024, 2048, 4096
32, 8, 2
64, 32, 16
92, 66, 38

an = 4(5)n-1


2, 5, 12, 15, 19, 4, 6, 11, 16, 18, 12, 12, 42
What effect does removing the outlier have on the distribution of the data?
What measure of center is best to use when we have outliers?
mean
median
mode
range

What percentage of the data is between 90 and 140?
25 %
50%
75%
100%


The table shows the points the JV basketball team scored in their first seven games. Calculate the mean, median, mode, and range. Which statistical measure best represents the team?

What is the most common sprint time according to the dot plot?
10.1
10.2
10.3
10.4

According to the histogram, how many people are 10 or younger?
4
6
10
11
Determine the Mean Absolute Deviation (MAD) of the data.
9, 7, 11, 10, 8

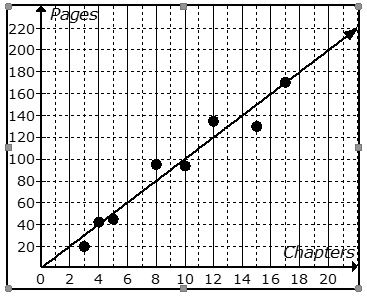
The scatter plot shows the relationship between the number of chapters and the total number of pages for several books. Use the line of best fit to predict how many chapters would be in a book with 140 pages.
12 chapters
19 chapters
14 chapters
21 chapters
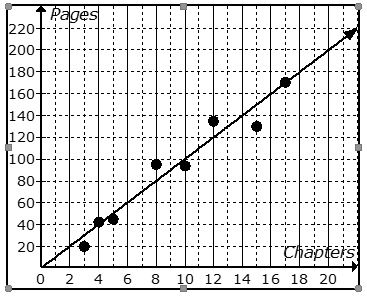
The scatter plot shows the relationship between the number of chapters and the total number of pages for several books. Use the line of best fit to predict how many pages would be in a book with 6 chapters.
100 pages
170 pages
60 pages
20 pages

What is the equation of the line of best fit?
y = -25x + 170
y = -5/8x + 170
y = 25x + 170
y = 5/8x + 170

Determine which type of function the equation represents:
y=5x2−7x+9
Linear
Quadratic
Exponential
Not a function
Determine which type of function the equation represents:
y=5(6.1)x−12
Linear
Quadratic
Exponential
Not a function

Determine which type of function the graph represents.
Linear
Quadratic
Exponential
Not a function

Determine which type of function the graph represents.
Linear
Quadratic
Exponential
Not a function
Which of the following equations represents a quadratic function?
y=3+2x2
x=2y2+3
y=3x−22
y=2x−3

Determine which type of function the graph represents.
Linear
Quadratic
Exponential
Not a function

Determine which type of function the graph represents.
Linear
Quadratic
Exponential
Not a function

Determine what type of function the following table represents.
Linear
Quadratic
Exponential
Not a function

Determine what type of function the table represents.
Linear
Quadratic
Exponential
Not a function

Determine what type of function the following table represents.
Linear
Quadratic
Exponential
Not a function
Number of steps taken per day and number of kilometers walked per day. r=.92
strong positive
strong negative
weak positive
weak negative
Score on science exam and number of words written on the essay question. r=.28
strong positive
strong negative
weak positive
weak negative

What is the range of the function shown?
−1≤y≤3
−1≤x≤3
5.3≤y≤27
5.3≤x≤27

What is the domain of the function shown?
x>1
y>1
x>−2
y>−2
Consider the given function that represents the balance in a bank account.
b(x)=850(1.025)x
What is the initial balance in the account?
(a)
Consider the given function that represents the balance in a bank account.
b(x)=850(1.025)x
Is the balance increasing or decreasing?
(a)
Consider the given function that represents the population of town.
f(x)=22000(0.94)x
Is the population of the town increasing or decreasing?
(a)
A small private school with a graduating class of 40 students in the year 2019 predicts that its graduating class will increase by 5% each year.
What function best represents this situation?
f(x)=40(0.95)x
f(x)=40(1.05)x
f(x)=5(0.60)x
f(x)=5(1.40)x
The value of a new video game is $40. The value is expected to decrease by 5% each year.
What function best represents this situation?
f(x)=40(0.95)x
f(x)=40(1.05)x
f(x)=5(0.60)x
f(x)=5(1.40)x

Which dashed line is the asymptote of this graph?
q
r
t
s

What is the equation of the horizontal asymptote for following exponential function?
y = -4
y > -4
y < -4
(0, -3)

Growth

Decay
a
y-intercept
y = abx
Exponential Function Equation
b
Growth/Decay Factor

2) The cost of tuition at a college is $12,000 and is increasing at a rate of 6% per year. What will the cost be after 4 years?
You have $5 and triple your money every day.
The value of a book is $58 and depreciates at a rate of 7% per year. Write an exponential function to find the value of the book after 8 years.
$32.46
$76.32
$54.26
$73.62
The population of a small town is 1600 and is increasing at a rate of 3% per year. Write an exponential function to model this situation. Then find the population of the town after 10 years.
2,150 people
1,738 people
2,128 people
1,819 people
Rewrite 64 as a power of 2:
22
26
43
28
52x = 5-x
Select ALL of the lines that are PERPENDICULAR to y = 3/4x + 9
y = 3/4x - 3
y = -3/4x + 9
y = -4/3x + 8
3y = -4x + 5
4y = -3x + 7
Line a passes through (2, 4) and (4, 7)
Line b passes through (-5, 3) and (-3, 6)
Lines a and b are ?
Parallel
Perpendicular
Neither
Slopes of parallel lines are...
negative reciprocals.
opposites.
the same.
always 7.
Slopes of perpendicular lines are...
negative reciprocals.
opposites.
the same.
always 7.
y = 3x +2
y = 3x - 3
These lines are...
Parallel
Perpendicular
Neither
y = 3/2x + 9
These lines are...
Choose ALL the lines PARALLEL to the following line: y = 2/9x - 7
y = 2/9x + 8
y = 9/2x -12
-2y = 9x + 8
9y = 2x -18
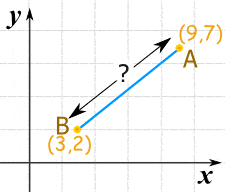
Given two points (x1, y1), (x2, y2) the distance between them is:
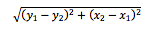
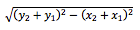
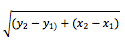
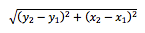
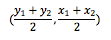
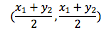
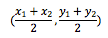
Which of the following is the correct midpoint formula given two endpoints (x1, y1) and (x2, y2)?


What is the area of the triangle?
60 square units
90 square units
45 square units
30 square units

What is the area of the parallelogram?
18 units2
20 units2
24 units2
30 units2

Use the map of Sarah's town to answer the question below.
What is the distance Sarah will travel from her house to Randi's?
5 units
6 units
8 units
10 units
When comparing two data sets, what does a smaller standard deviation indicate?
The data is skewed to the left.
The data points are closer to the mean.
The data points are further from the mean.
The data is normally distributed.
Data set A has a range of 15, while data set B has a range of 25. What can we infer about the variability of these two data sets?
Data set A is more spread out than data set B.
Both data sets have the same spread.
Neither data set has any variability.
Data set B is more spread out than data set A.
Which of the following describes a situation where it would be better to use the median instead of the mean?
When the data set is symmetrical.
When there is no mode.
When data points are all positive.
When there is a significant outlier.

The box plots show data from a survey of students under 14 years old. They were asked on how many days in a month they read and draw. Based on the box plots, which is a true statement about the students?
The "Read" data has the lower median
The "Draw" data has a larger interquartile range
The "Read" data has the highest value
The "Draw" data has an outlier
20, 52, 86, 80, 44, 49, 57, 41, 44, 55
Q1 = 3
Q2 = 7
Q3 = 12
Cora invested $400 at a rate of 35% for 8 months, compounded continuously. How much is her investment worth after 8 months?
$520.07
$505.12
$460.11
$7,643.74
Quarterly means how many times a year?
4
2
1
6
Karla invested $1,000 in savings bonds. If the bonds earn 6.75% interest compounded semi-annually, how much total will Karla earn in 15 years?
$1,584.62
$2,651.39
$2,706.86
$1,825.10

