
 Worksheets
Data
Total questions: 20
Worksheet time: 16mins
Name
Class
Date
1.
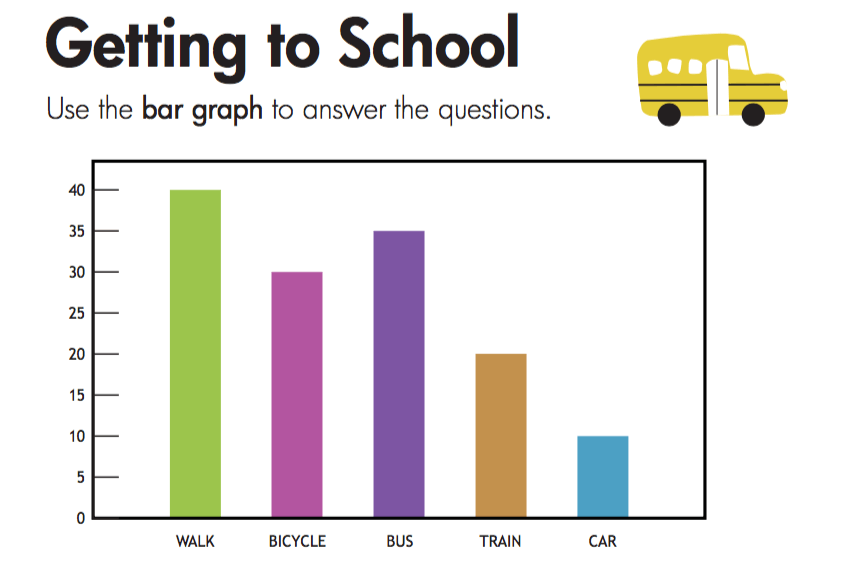
How many students ride their bicycle to school?
a)
40
b)
35
c)
30
d)
20
2.

How many tally marks?
a)
12
b)
25
c)
15
d)
20
3.

Which two animals are same in number?
a)
Lions and ducks
b)
whales and ducks
c)
lion and tortoise
4.

How many tortoises are there in this picture?
a)
3
b)
2
c)
1
d)
5
5.

How many total votes were collected?
a)
5
b)
10
c)
15
d)
20
6.

How many cupcake on Wednesday?
a)
4
b)
24
c)
8
d)
42
7.

Which pet got the most votes?
a)
Dog
b)
Cat
c)
Fish
8.

Which fruit did most children choose?
a)
Apple
b)
Banana
c)
Grapes
9.

Which tally chart shows the right number of each snack?
a)
b)
10.
Which fruit did most children choose?
a)
Apple
b)
Banana
c)
Grapes
11.

What type of graph is this?
a)
Bar Graph
b)
Pictograph
c)
Line Plot
d)
Tally Chart
12.

How many more people have purple for a favorite color than red?
a)
3
b)
5
c)
7
d)
9
13.

What is the title of the graph?
a)
Number of people
b)
Character
c)
Favorite Cartoon Characters
d)
Sponge Bob
14.

How many children like hamsters?
a)
0
b)
2
c)
4
d)
6
15.

How many children like dogs?
a)
10
b)
8
c)
9
d)
4
16.

How many votes did reading receive?
a)
2
b)
4
c)
6
d)
8
17.

How many votes did reading and social studies receive together?
a)
9
b)
11
c)
13
d)
15
18.

How many more kids liked hamburgers more than chicken?
a)
12
b)
9
c)
11
19.

What item did my dog buy the most of?
a)
collars
b)
dresses
c)
hair bows
20.

How many items did my dog purchase?
a)
12
b)
11
c)
6
100 %

