
NEW
Font size
 Worksheets
2nd Semester Review Part 2
Total questions: 47
Worksheet time: 1hrs 6mins

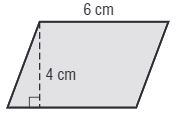

What shape is this?
Rectangle
Parallelogram
Trapezoid
Dodecahedron
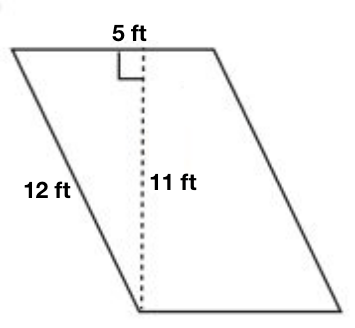

Find the area of the rectangle.
400 mm2
420 mm2
441 mm2

What is the area of this parallelogram?
20 units2
28 units2
35 units2

What is the area of this parallelogram?
6 units2
10 units2
12 units2
16 units2
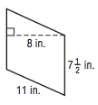
Find the area.
88 inches2
82.5 inches2
660 inches2
60 inches2

Find the AREA of this figure.
10 cm2
625 cm2
25 cm2
20 cm2
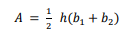
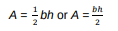
Which is the correct area formula for Parallelograms?


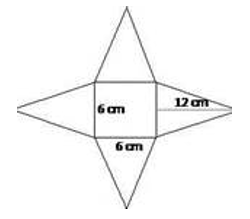
Name the net of the image.
rectangular prism
triangular pyramid
cube
rectangular pyramid

The net of a 3D object is above, when it is folded up, which 3D image will it create?


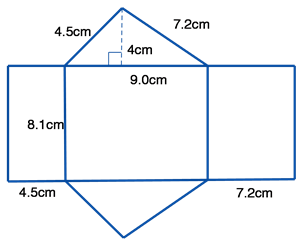
What is the surface area of the triangular prism?
195 cm2
135 cm2
89 cm2
81 cm2

Chloe ordered her favorite slice of cheesecake at the Cheesecake Factory. She asked her waitress to please wrap her cheesecake up so that she could take it home. How much plastic wrap will the waitress need in order to cover the surface area of the cheesecake?
If the waitress tears off 70 in2 of plastic wrap, will she have enough plastic wrap to cover the cheesecake?
49.5 in2 ; No
31.5 in2 ; No
67.5 in2 ; Yes
76.5 in2 ; Yes

What is the surface area of the Rubik's Cube?
36 cm2
216 cm2
144 cm2
42 cm2

Find the surface area of the rectangular prism.
104 cm2
32 cm2
208 cm2
18,432 cm2
How many square centimeters of wrapping paper are needed to cover the surfaces of the box?
108 cm2
324 cm2
180 cm2
432 cm2
What shape is this?
Triangular Prism
Triangular Pyramid
Rectangular Pyramid
Rectangular Prism

What 3D shape is this?
Rectangular Prism
Rectangular Pyramid
Cube
Triangular Prism

Find the TOTAL surface area of the pyramid shown.
66 cm2
231 cm2
165 cm2
55 cm2

Find the surface area of the rectangular prism.
29 cm2
912 cm2
348 cm2
438 cm2

What is the total surface area of this shape?
50 cm2
700 cm2
900 cm2
50,000 cm2
Which data point affects the range of the data set the most?
30, 35, 90, 40, 20, 30, 30, 20
30
40
90
35

Leonard asked his math class, “How many minutes does it take for you to walk to school?” He graphed the results on the line plot above.
The mean is about 18.6; there are no gaps or outliers; a peak at 20; the data is non-symmetrical
The median is 20; the data is symmetrical; 0 is the outlier; there are no gaps
The mode is 20; the data is skewed right; and there is a gap at 30-35
The range is 30; there is a peak at 20; 0 is an outlier; the data is skewed left
Bernadette had the following test scores: 100, 98, 71, 99.
Which measure of center best describes her test scores and why?
The range because 71 is the outlier.
The mean because the data set does NOT have an outlier.
The median because the data set DOES have an outlier.
The mode because 98.5 is in the middle.
Howard and Leonard are visiting Six Flags. Howard is using his cell phone app to record the wait time for various rides. Howard asked Leonard to jot down the wait times below.
18, 20, 39, 42, 42, 48, 50, 53, 58, 60, 72, 78
Which histogram represents the results?


Using the words peak, gap, skewed left, skewed right, clusters, symmetry, describe the line plot above.
There are gaps at 24-25; it is skewed to the left, it is non-symmetrical, and there is a cluster between 26-30.
The cluster is between 26-30, it is skewed to the right, the peak is at 30.
It is skewed left, it is symmetrical, the peak is at 29, and there is a gap at 20.
The peak is at 29, there is a cluster at 31-32, there is a gap at 24-25, it is non-symmetrical.
Raphael recorded the swim times of his teammates for the 50 meter Freestyle (measured in seconds).
29, 25, 20, 23, 28, 22, 21, 27, 23
What are the Minimum, First Quartile, Median, Third Quartile, and Maximum for the data?
Minimum - 29
First Quartile - 21
Median - 25
Third Quartile - 25
Maximum - 29
Minimum - 20
First Quartile -23
Median - 28
Third Quartile - 28
Maximum - 29
Minimum - 20
First Quartile - 22
Median - 23
Third Quartile - 27
Maximum - 29
Minimum - 20
First Quartile - 22
Median - 28
Third Quartile -28
Maximum - 29

Mrs. Johnson wrote down the number of pages each student has read this week in the table above.
Calculate the mean, median, and mode of the data set.
Mean - 231
Median - 206
Mode - 198
Mean - 231
Median - 213
Mode - 198, 200
Mean - 213
Median - 231
Mode - 220
Mean - 213
Median - 220
Mode - 198, 220
Which of the following statements is TRUE?
0.252 > 0.25
∣−6∣≥8
−43>∣−1.5∣
−2 51≥6.2
A shark is 12 feet below the surface of the water in the ocean. The surface of the ocean is represented by the number 0, and the shark is represented by the number -12. A child is flying a kite the same distance above the surface of the water as the shark that is swimming below the surface of the water.
What number represents the location of the kite?
-12
0
24
12

Penny walks from the lighthouse to the game store, then to the city hall. What is the total distance she walked?
4 miles
9 miles
5 miles
6 miles

Suppose it took Gabe 10 minutes to walk 1 mile. At this rate, how many minutes would it take Gabe to walk from the museum to the coffee shop?
Each unit on the grid represents 1 mile.
40 minutes
1/2 hour
50 minutes
90 minutes
Which of the following statements is TRUE?
0.252 > 0.25
∣−6∣≥8
−43>∣−1.5∣
−2 51≥6.2
A shark is 12 feet below the surface of the water in the ocean. The surface of the ocean is represented by the number 0, and the shark is represented by the number -12. A child is flying a kite the same distance above the surface of the water as the shark that is swimming below the surface of the water.
What number represents the location of the kite?
-12
0
24
12

The weatherman reported that the temperature in February is warmer than the temperature in January. Do you agree? Why?
No, because -10 is colder than -18. Thus, February is colder.
Yes, because -18 is further to the left on the numberline than -10. Thus, February is warmer.

The low (L) temperature for the next month are shown with the inequality below. What two values could represent a low (L) temperature to make the inequality true?
L < -9
9 and -18
0 and -10
-18 and -21
0 and -21

Which inequality correctly compares the elevations of Indiana and Alaska?
−279 ≥ 320
320 ≤ −279
−279 > 320
320 > −279

The table shows the change in weight for four friends during their time in quarantine.
Identify which number line represents the changes in weight for each person.


Six points are graphed on the coordinate plane. Which three points graphed on the coordinate plane show the locations of the three ordered pairs below? (-3, 0) (1, -2) (0, -3)
W, B, A
A, B, W
W, R, A
A, T, W

In which quadrant is (-4, -5) located?
I
II
III
IV

In which quadrant is (3, -1) located?
I
II
III
IV

Using the coordinate grid, if the ordered pair T (1, -2). is reflected over the x-axis, which point would be the resulting coordinate?
B
R
N
W

The diagram shows the locations of the grocery store, police station, restaurant, bus stop, and a park. Each unit on the grid represents 1 kilometer. What is the distance between grocery store and the bus stop?
4 km
3 km
-4 km
2 km

Dylan’s friend Olivia lives halfway between the restaurant and the park. What is the coordinate location of Olivia’s house on the graph?
(5, -2)
(5, 1)
(5, -5)
(5, 0)

What are the coordinates for point D?
(5, 3)
(4, -2)
(5, -3)
(-6, -4)

