
 Worksheets
BAR GRAPH AND PICTOGRAM
Total questions: 15
Worksheet time: 21mins
Name
Class
Date
1.

a)
Ginger Snap
b)
Oatmeal Cookie
c)
Sugar Cookie
2.

How many students like vanilla and chocolate?
a)
8
b)
32
c)
30
d)
28
3.
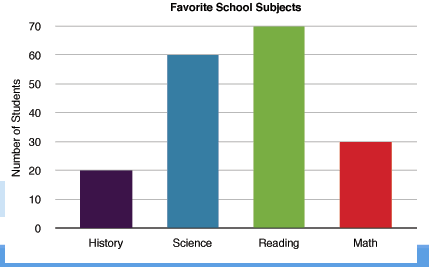
Which subject has 10 fewer votes than Reading?
a)
History
b)
Science
c)
Math
d)
Spelling
4.

Which subject received the most votes?
a)
science
b)
reading
c)
social studies
d)
math
5.

How many more students played soccer than football?
a)
3
b)
30
c)
6
d)
60
6.

Which pizzeria has the second largest sales?
a)
Pizza House
b)
Domiano's Pizza
c)
Little Secrets Pizza
d)
Uncle John's Pizza
7.

How many people voted for red as their favorite color?
a)
100
b)
2
c)
4
d)
9
8.

What type of graph is this?
a)
Bar Graph
b)
Pictograph
c)
Line Plot
d)
Tally Chart
9.

How many total votes were collected?
a)
5
b)
10
c)
15
d)
20
10.

What type of graph is this?
a)
bar graph
b)
pictograph
c)
tally chart
11.

How many tally marks?
a)
9
b)
6
c)
3
d)
7
12.

How many tally marks?
a)
2
b)
1
c)
3
d)
6
13.

Which fruit did most children choose?
a)
apple
b)
banana
c)
grapes
14.

Choose the sentence that describes the data in the tally chart.
a)
Pizza had 10 votes.
b)
Pizza got the most votes
15.

What type of graph is this?
a)
bar graph
b)
picture graph
c)
tally chart
d)
line graph
100 %

