wayground logo

Free Printable Worksheets

Font size

S
M
L
XL
Worksheets

Module 6 Review

Total questions: 145

Worksheet time: 10hrs 53mins

Name
Class
Date
1.

A regular 6-sided die is to be rolled one time. What is the probability that the number 5 is rolled?

a)

1/5

b)

5/6

c)

1/6

d)

6/5

2.

A regular 6-sided die is to be rolled once. What is the probability that a number less than 3 is rolled?

a)

1/3

b)

1/6

c)

1/2

d)

2/3

3.
Theoretical Probability is?
a)
What Should happen
b)
What does happen
c)
What Will Happen
d)
What I want to Happen
4.
A jar contains 2 pink, 6 red, and 4 blue marbles. If you pick one marble without looking, what is the probability that the marble you pick will be red or blue?
a)
5/6
b)
1/2
c)
1/3
d)
1/6
5.
The chart below represents the number of marbles in a jar.
P(green) = 
a)
5/19
b)
10/28
c)
5/14
6.
A bag contains 30 pieces of candy. There are 15 grape, 7 cherry, 3 lemon, 5 strawberry. What is the probability of drawing a lemon?
a)
3
b)
1/10
c)
3/10
d)
30%
7.
P(not A) = 
*Remember to simplify.*
a)
6/8
b)
3/4
c)
2/8
d)
1/4
8.
Rolling a 15 on a number cube is 
a)
Impossible
b)
Certain
c)
Unlikely
d)
Equally Likely
9.

How many outfits are possible with 2 pairs of jeans, 5 t-shirts, and 2 pairs of shoes? (Hint: Use a list, tree diagram or the Fundamental Counting Principle.)

a)

9

b)

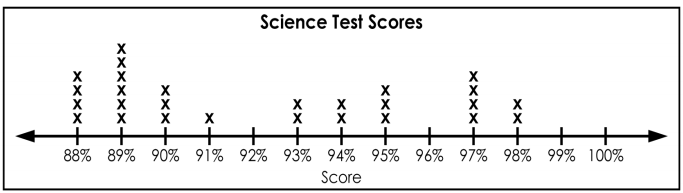
40

c)

20

d)

10

10.

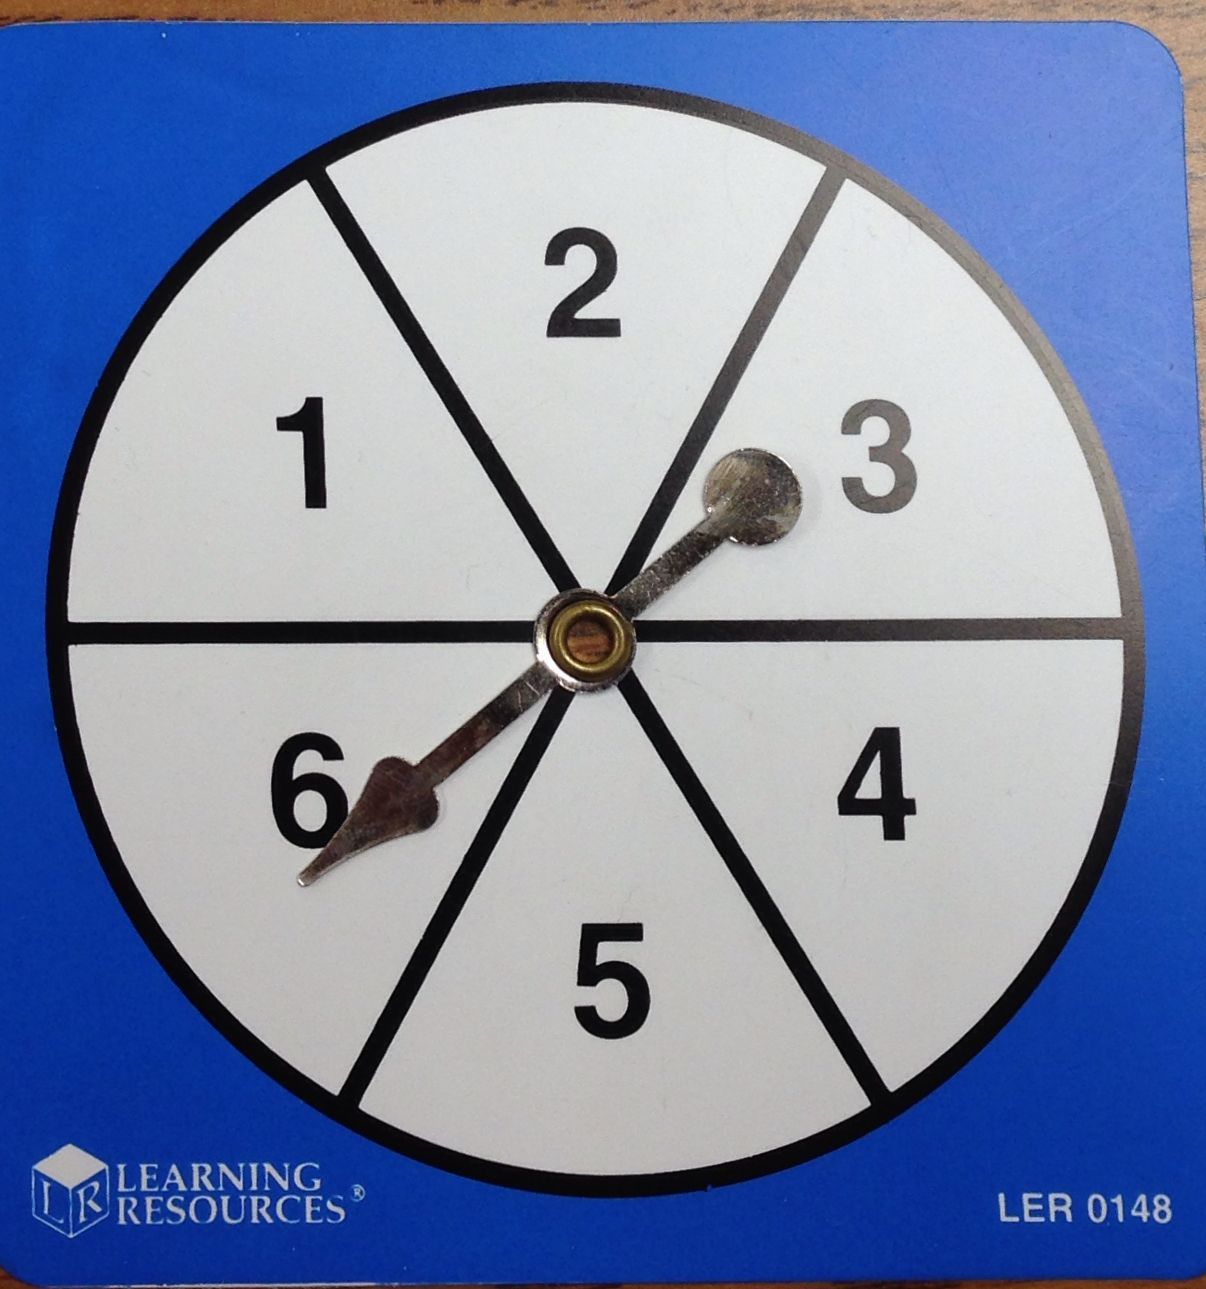
What is the probability of spinning a 2 on the spinner?

a)

1/2

b)

1/3

c)

1/8

d)

1/4

11.

What is the probability the spinner stops on yellow?

a)

.075

b)

50%

c)

25%

d)

3/8

12.

What is the probability of the spin stopping on yellow?

a)

1/4

b)

.25

c)

50%

d)

75%

13.

What is the probability of spinning an even number?

a)

0.25

b)

0.33

c)

50%

d)

75%

14.
Probability can be written as a 
a)
fraction
b)
decimal
c)
percent
d)
all of the above
15.
A die is rolled. What is the probability that the result is less than 3 ?
a)
1/2
b)
1/3
c)
1/4
d)
1/6
16.

Probability (as a decimal) is between which two numbers?

a)

0-100

b)

5-10

c)

0-1

17.

Find the probability of rolling a 7 on a single die.

a)

1/6

b)

7/6

c)

0

d)

7/7

18.
The letters that form the word ALGEBRA are placed in a bowl. What is the probability of choosing a letter other than “A”? 
a)
2/7
b)
5/49
c)
5/7
d)
10/49
19.

A box has 3 limes, 5 grapes, and 2 oranges.


P (NOT lime)

a)

3/10

b)

30%

c)

7/10

d)

Answer Not Here

20.
What is the probability of spinning red?
a)
0
b)
1/2
c)
3/4
d)
1
21.
A jar contains 2 pink, 6 red, and 4 blue marbles. If you pick one marble without looking, what is the probability that the marble you pick will be red or blue?
a)
5/6
b)
1/2
c)
1/3
d)
1/6
22.
What is the probability of choosing a vowel from the alphabet?
a)
21/26
b)
5/26
c)
1/21
d)
7/21
23.
Theoretical Probability is?
a)
What Should happen
b)
What does happen
c)
What Will Happen
d)
What I want to Happen
24.

If you select a marble without looking, how likely is it that you will pick a black one?

a)

certain

b)

probable

c)

unlikely

d)

impossible

25.

If you select a marble without looking, how likely is it that you will pick a black one?

a)

certain

b)

probable

c)

unlikely

d)

impossible

26.

If you select a marble without looking, how likely is it that you will pick a black one?

a)

certain

b)

probable

c)

unlikely

d)

impossible

27.

If you select a marble without looking, how likely is it that you will pick a black one?

a)

certain

b)

probable

c)

unlikely

d)

impossible

28.

If you select a marble without looking, how likely is it that you will pick a white one?

a)

certain

b)

probable

c)

unlikely

d)

impossible

29.

If you flip a coin, what is the probability that it will land on heads?

a)

1/4

b)

1/8

c)

1/2

d)

1/3

30.

If you roll a 6-sided die, what is the probability of rolling a two?

a)

2/6

b)

1/6

c)

1/3

d)

1/5

31.

What is the probability that the spinner will land on yellow?

a)

certain

b)

probable

c)

unlikely

d)

impossible

32.

If you reach in the bag and pull out a marble. What is the probability that it will be green?

a)

1/5

b)

1/2

c)

5/9

d)

impossible

33.

If you select a marble without looking, what is the probability that it will be blue?

a)

1/3

b)

2/5

c)

1/6

d)

impossible

34.

What is the probability of pulling a blue cube from the bag?

a)

2/6

b)

2/3

c)

1/6

d)

impossible

35.

What is the probability of catching a blue bug?

a)

1/2

b)

6/11

c)

1/6

d)

impossible

36.

What is the probability of picking a shirt and pant combo with Jeans?

a)

3/6

b)

1/6

c)

3

d)

2/6

37.
Mean:
1   2   3   4   5   6
a)
2.5
b)
3
c)
3.5
d)
4
38.
Median:
0   1   2   3   4
a)
1
b)
2
c)
3
d)
4
39.
Mode:
0   1   1   2   3   4
a)
1
b)
2
c)
3
d)
4
40.
Range:
67, 74, 95, 98, 98, 99, 102
a)
102
b)
67
c)
98
d)
35
41.
Mean:
67, 74, 95, 98, 98, 99, 102
a)
90.4
b)
633
c)
98
d)
92.3
42.
Median:
67, 74, 95, 98, 98, 99, 102
a)
102
b)
67
c)
98
d)
90.4
43.
Mode:
67, 74, 95, 98, 98, 99, 102
a)
90.4
b)
35
c)
92
d)
98
44.
Range:
10   12   13   15   16.5
a)
6.5
b)
13
c)
66.5
d)
13.3
45.
Mean:
101   104   106   112   120
a)
543
b)
108.6
c)
106
d)
120
46.

Ervin bowled 7 games last weekend. His scores are: 155, 165, 138, 172, 127, 193, 142. What is the range of Ervin's scores?

a)

193

b)

127

c)

60

d)

66

47.

The scores awarded to 25 students for an assignment were as follows:

4 7 5 9 8 6 7 7 8 5 6 9 8 5 8 7 4 7 3 6 8 9 7 6 9

What is the mode?

a)

6

b)

7

c)

8

d)

9

48.
Find the median of these numbers:
4,2,7,4,3
a)
2
b)
5
c)
7
d)
4
49.
In order to find the median, the data must be sorted from least to greatest first.
a)
True
b)
False
50.
What is the range?
a)
average
b)
biggest-smallest
c)
the middle #
d)
# happening the most
51.
What is the mean?
a)
# happening the most
b)
the number in the middle
c)
biggest-smallest
d)
the average
52.
What is the median?
a)
biggest- smallest
b)
average
c)
the middle #
d)
# that happens the most
53.
What is the mode?
a)
# happening the most
b)
the average
c)
biggest - smallest
d)
the middle #
54.
The mode score on the 6th grade math test was 94! Which of these interpretations must be correct?
a)
99 was the highest score on the test.
b)
More students received a 94 than any other score
c)
No student scored below a 50
d)
A score of 91 was slightly below average.
55.

What is the range in gas mileage for cars?

a)

2

b)

3

c)

4

d)

6

56.
What is the MEAN for this data?
a)
80
b)
1040
c)
13
d)
81
57.

What is the median number of minutes read by the students?

a)

45

b)

40

c)

50

d)

55

58.
What is the mean of these numbers?
4,5,5,2,3,3,2,8
a)
40
b)
24
c)
4
d)
256
59.
What is the mean for these numbers?
5,5,5,5
a)
5
b)
20
c)
15
d)
100
60.

Calculate the mean.

2, 9, 10, 6, 8

a)

8

b)

4

c)

7

d)

22

61.
Find the median:
3, 5, 7, 4, 3, 1
a)
3 and 4
b)
There isn't one
c)
3.5
d)
3
62.
To find the average of a set of numbers, add up all the items and divide by...
a)
2
b)
The minimum
c)
The maximum
d)
The number of items
63.
Mary read six books in January, four books in February, and eight books in March.What was the average number of books read each month? __________
a)
18
b)
6
c)
14
64.
When finding the median, what do you do if there are two middle numbers?
a)
Add them together and divide by 2
b)
Write them both as the answer
c)
Give up
d)
Pick one
65.
The number of miles that Kiki cycled each week for a 7-week period is shown: 
36, 42, 28, 52, 48, 36, 31 
What is the median number of miles Kiki cycled?
a)
24
b)
36
c)
39
d)
52
66.
The cost of four cell phones are $345, $400, $110, and $640.
What is the median cost
a)
$330
b)
$390
c)
$372.50
d)
$375
67.
Lizzy had test scores of:   72, 94, 108, 60
What is the RANGE of her test scores?
a)
12
b)
72
c)
48
d)
98
68.
What is the range?
8, 10, 60, 3, 5, 13, 12, 40, 8
a)
55
b)
8
c)
57
d)
17.7
69.
What is the mode?
a)
# happening the most
b)
the average
c)
biggest - smallest
d)
the middle #
70.

Q2 is the same as the ______

a)

Mean

b)

Median

c)

Mode

d)

Range

71.

Q1 is the median (middle) of the lower half of the data values.

a)

True

b)

False

72.

IQR = Q3 - Q1

a)

True

b)

False

73.

What is the RANGE of the following data set?

4, 5, 6, 8, 9, 10, 11

a)

5

b)

6

c)

7

d)

8

74.

What is the Q1, Q2, and Q3 of the following data set?

4, 5, 6, 8, 9, 10, 11

a)

Q1: 4

Q2: 8

Q3: 11

b)

Q1: 5

Q2: 8

Q3: 10

c)

Q1: 4

Q2: 5

Q3: 6

75.

What is the IQR of the following data set:

4, 5, 6, 8, 9, 10, 11

a)

5

b)

6

c)

7

d)

There is not enough information

76.

What is the IQR of the following Data Set:

32, 35, 35, 36, 39, 40, 44, 48, 49

a)

Q1: 35

Q2: 39

Q3: 46

IQR: 46 - 35 = 11

b)

Q1: 35

Q2: 39

Q3: 44

IQR: 44 - 35 = 9

c)

Q1: 35

Q2: 39

Q3: 48

IQR: 48 - 35 = 13

d)

Q1: 35

Q2: 39

Q3: 46

IQR: 39 - 35 = 4

77.

What is the IQR of the following Data Set:

1, 3, 4, 5, 5, 7, 9

a)

Q1: 3

Q2: 4

Q3: 6

IQR: 6 - 3 = 3

b)

Q1:3.5

Q2: 5

Q3: 8

IQR: 8 - 3.5 = 4.5

c)

Q1: 3

Q2: 5

Q3: 7

IQR: 7 - 3 = 4

78.

How many books do each student in your class have?

a)

Statistical

b)

Non-statistical

79.

What is your favorite color?

a)

Statistical

b)

Non-statistical

80.

How long did it take for each person to get to to school?

a)

Statistical

b)

Non-statistical

81.

How many siblings do you have?

a)

Statistical

b)

Non-statistical

82.

How many homes were sold each day this month?

a)

Statistical

b)

Non-statistical

83.

How many homes were sold this month?

a)

Statistical

b)

Non-statistical

84.

How long does it take you to travel to school every day?

a)

Statistical

b)

Non-statistical

85.
Is the following question statistical or non statistical?
How many cars are in the parking lot?
a)
Statsitical
b)
Non Statistical
86.
Is the following question statistical or non statistical?
What pets do students in our class have?
a)
Statistical
b)
Non statistical
87.
Is the following question statistical or non statistical?
On average, how many siblings do students in our class have?
a)
Statistical
b)
Non Statistical
88.

Favorite food

a)

categorical

b)

numerical

c)

data that changes over time

89.

Total family members

a)

categorical

b)

numerical

c)

data that changes over time

90.

Number of teeth each year (ages 5-10)

a)

categorical

b)

numerical

c)

data that changes over time

91.

Favorite color

a)

categorical

b)

numerical

c)

data that changes over time

92.

Like or dislike of math

a)

categorical

b)

numerical

c)

data that changes over time

93.

Number of teeth lost

a)

categorical

b)

numerical

c)

data that changes over time

94.

Number of states visited

a)

categorical

b)

numerical

c)

data that changes over time

95.

Favorite grade

a)

categorical

b)

numerical

c)

data that changes over time

96.

Favorite candy

a)

categorical

b)

numerical

c)

data that changes over time

97.

Number of books read over the summer

a)

categorical

b)

numerical

c)

data that changes over time

98.

Favorite sport

a)

categorical

b)

numerical

c)

data that changes over time

99.
How many more students scored a 98 than scored a 88?
a)
4
b)
2
c)
6
d)
35
100.
How many students scored 93% or less?
a)
6
b)
16
c)
14
d)
13
101.
How many students spent 7 hours doing homework that week?
a)
1
b)
3
c)
5
d)
6
102.
How many total students are in the science class?
a)
13
b)
6
c)
27
d)
25
103.
Each dot represents 1 day. How many days were recorded?
a)
9
b)
21
c)
20
d)
105
104.
What is the difference between the highest score and the lowest score on the test?
a)
15
b)
100
c)
6
d)
10
105.
How many students scored between 95 and 100?
a)
6
b)
6
c)
9
d)
14
106.
What is the MEDIAN of this data
a)
95
b)
90
c)
100
d)
40
107.
What is the RANGE of this data
a)
40
b)
95
c)
90
d)
100
108.
What is the MODE of this data?
a)
100
b)
20
c)
80, 85, and 90
d)
none
109.
What is the MEDIAN of this data?
a)
65
b)
40
c)
915
d)
13
110.
What is the MEAN for this data?
a)
80
b)
1040
c)
13
d)
81
111.
How many students spent 7 hours doing homework that week?
a)
1
b)
3
c)
5
d)
6
112.
How many total students are in the science class?
a)
13
b)
6
c)
27
d)
25
113.
What is the highest score in the class?
a)
88%
b)
100%
c)
13
d)
98%
114.
How many people have two or less books in their desk?
a)
4
b)
5
c)
6
d)
7
115.

Type of Data arrangement

a)

Symmetrical

b)

Hairline

c)

Skewed Right

d)

Skewed Left

116.
a)

Skewed up box

b)

Skewed to the left

c)

Skewed to the right

117.
What is the shape of the distribution?
a)
Skewed Left 
b)
Skewed Right
c)
Symmetric
d)
Bimodal
118.
What is the shape of the distribution?
a)
Skewed Left 
b)
Skewed Right
c)
Symmetric
d)
Bimodal
119.
What is the shape of the distribution?
a)
Skewed Left 
b)
Skewed Right
c)
Symmetric
d)
Bimodal
120.
Describe the data distribution shape of the graph.
a)
Skewed right
b)
Skewed left
c)
Uniform
d)
Symmetrical
121.
Describe the histogram:
a)
Left Skewed
b)
Symmetrical
c)
Right Skewed
d)
Uniform
122.
How would you describe this distribution?
a)
Left skewed
b)
Uniform
c)
Right Skewed
d)
Symmetrical
123.
Which of the following best describes the shape of the distribution?
a)
SKEWED LEFT
b)
SKEWED RIGHT
c)
UNIFORM
d)
SYMMETRICAL
124.
How many students were greater than or equal to 60 inches tall?
a)
21
b)
11
c)
17
d)
6
125.
Which interval shows the greatest number of pets?
a)
15-19
b)
0-4
c)
5-9
d)
10-14
126.
What is an interval?
a)
A single number
b)
A range of numbers
c)
A percentage
d)
A total amount
127.
21. How many students are represented by the histogram?  
a)
Cannot be determined
b)
9
c)
31
d)
35
128.
How many students scored between a 86 and a 90?
a)
1
b)
3
c)
6
d)
10
129.
How many students are between 48 and 51 inches tall?
a)
14
b)
8
c)
2
d)
0
130.
How many students are between 60 and 63 inches tall?
a)
3
b)
0
c)
12
d)
7
131.
Which interval has 4 students?
a)
56-59
b)
60-63
c)
60-67
d)
48-51
132.
How many men had finishing times between 60 and 64 minutes?
a)
9
b)
0
c)
7
d)
5
133.

How many students sent between 10 and 19 text?

a)

25

b)

22

c)

15

d)

45

134.

How many students sent more than 29 text messages?

a)

45

b)

25

c)

95

d)

199

135.

Which interval contained the fewest scores?

a)

0-9

b)

50-59

c)

both 0-9 and 50-59

d)

10-19

136.

What percent of the students sent between 40 and 59 text messages?

a)

45%

b)

25 text messages

c)

45 text messages

d)

25%

137.

How many vehicles get less than 17 miles per gallon?

a)

20

b)

15

c)

14

d)

25

138.
What color car is the least popular at this car dealership?
a)
Red
b)
White
c)
Blue
d)
Green
139.

How many boys have shoes that are 18 centimeters long?

a)

6

b)

10

c)

2

d)

5

140.
How many children participated in the survey?
a)
34
b)
30
c)
32
d)
6
141.
a)
5
b)
7
c)
8
d)
9
142.
a)
11
b)
1
c)
2
d)
9
143.

How many students voted for fish or cat?

a)

10

b)

6

c)

4

d)

2

144.

How many fewer students bird than fish?

a)

2

b)

6

c)

4

d)

8

145.

How many students does they like dog.

a)

4

b)

8

c)

10