
 Worksheets
Data charts and graphs
Total questions: 53
Worksheet time: 3hrs 33mins

How many people liked grape the best?
6 people
8 people
10 people
11 people

How many more people liked soccer than liked baseball?
2 people
3 people
4 people
7 people
How do you show the number 12 with tally marks?


How many people voted in the survey about favorite colors?
2 people
8 people
10 people
15 people

How many votes did cats and birds receive?
6 people
7 people
11 people
14 people

The graph shows the number of cars sold from January to April. How many more cars were sold in March than in January?
2,000
5,000
7,000
8,000


9
10
8

2
3
1

4
1
3

7
4
1

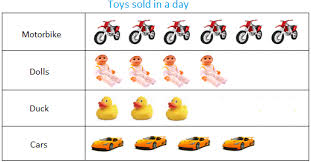
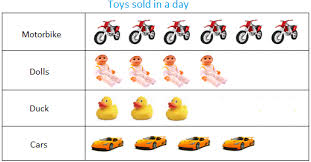
How many chickens does Nate have on his farm?
11
12
9
10

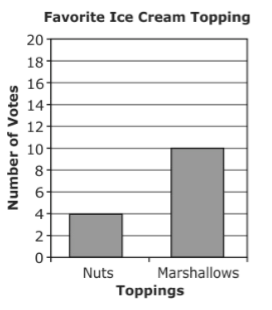
Students voted for their favorite ice cream topping. How many more students chose marshmallows than chose nuts?
4
6
10
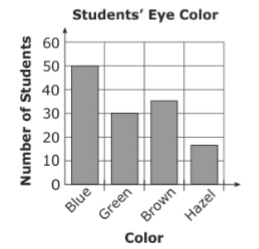
Miss Lee's science class collected data on the color of 3rd grade student's eyes. The students created a bar graph with this information. How many more students had blue eyes than green eyes?
80
50
30
20

Jack made this graph to show the number of movies that were rented from his store during four months. Which whole number shows how many more movies were rented in December than in September?
20
35
45
80

The graph shows the number of colored beads used to make a necklace. How many purple and green beads were used in all?
23
20
18
15

How many strawberries does Ed have?
2
20
6
4

How many strawberries do Ed and George have together?
5
10
9
13

How many strawberries does Cerise have?
9
7
5
4

How many strawberries are there altogether
16
15
32
30

Which food was the most popular food?
Pizza
Breakfast
Chicken nuggets

How many people voted for Pizza?
8
4
5
9

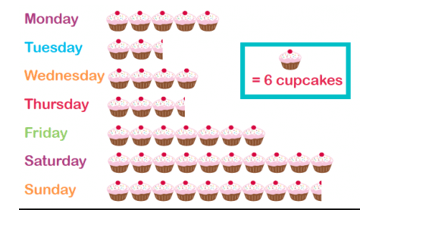
How many people ate cupcakes on Tuesday and Wednesday?
1
24
39
40
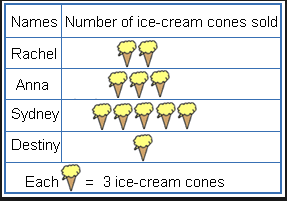

How many students take the bus to school?
35
20
10
15
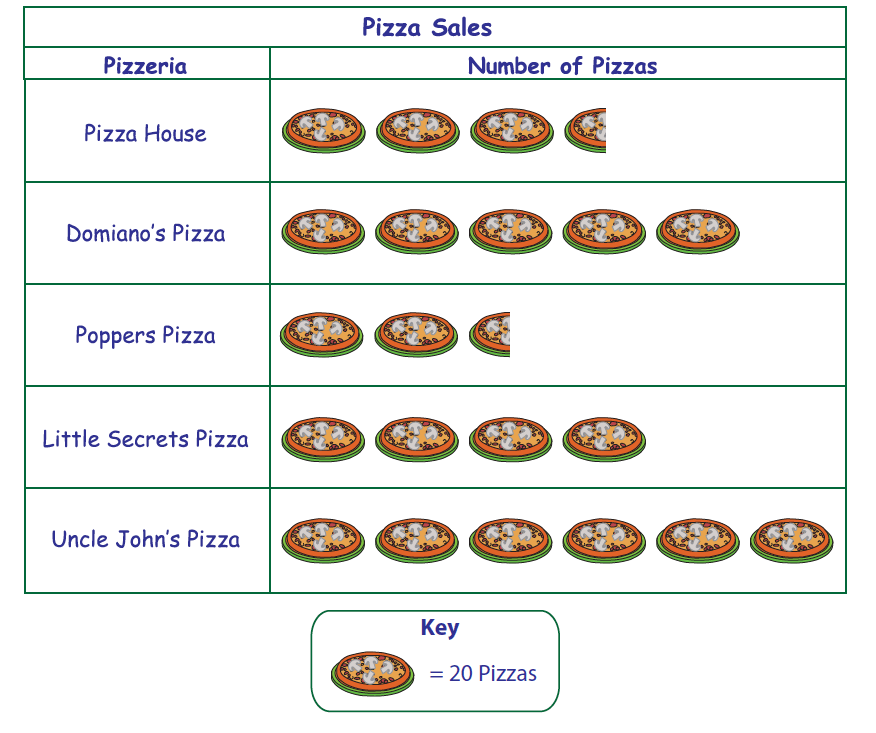
How many pizzas were sold by Peppers Pizza?
50
3
30
2 and a half

How many more students play basketball than hockey?
60
10
2
20

How many MORE people voted for hamster than dog?
2
1
6
3
How many MORE people voted for cat than dog?
2
1
6
3
How many students play soccer and baseball?
90
40
50
110

How many fewer fish did Mike catch on Saturday than on Sunday?
1
3
6
8

How many like purple the best?
6
7
8
9

How many students like yellow and orange combined?
7
14
8
16

A restaurant recorded the number of pizzas sold each month for one year. The data are shown in the graph below. During which month did the restaurant sell 40 pizzas?
March
May
July
August



Use the line graph above to answer the question:
Which day of the week had the best hot dog sales?
Monday
Tuesday
Thursday
Friday

How many push ups were done on Tuesday?
25
15
5
10

How many more potatoes were grown in 2011 than in 2009?
5
10
15
20

How many hot dogs were sold altogether?
30 hot dogs
100 hot dogs
180 hot dogs
80 hot dogs



How many students bought 5 candy bars?
3
1
2
4

