
 Worksheets
Python
Total questions: 118
Worksheet time: 3615secs
print("Hello world!\nHello world!")
Hello world!
print("Hello" + str(2) + "world!")
What does the following code do? myAge = int (myAge)
Converts the var (variable) myAge to a string
Converts the var (variable) myAge to a integer
Converts the var (variable) myAge from a integer to a string
Converts the var (variable) myAge to if statement
print(Hello world!)
print("Hello world!" * 2)
people = ["John", "Rob", "Bob"]
print (people[1])
what would this result be?
people = ["John", "Rob", "Bob"]
print (people[-1])
what would this result be?
people = ["John", "Rob", "Bob"]
print (people[4])
what would this result be?
What is the Python built-in function used to display numbers and text on the screen?
input
output
command
If you want to create an empty list called colours in Python, which of the following is correct?
colours = [ ]
colours = ( )
colours = { }
colours = <>
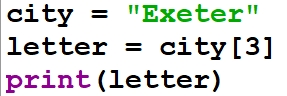


Each item in a list has an index. What is the first index in a Python list?
0
1
a
A


What will the output be from the following code?
print(3+4)
3+4
7
SyntaxError
print(3+4)
What would this print?
What will the output be from the following Python code?
Print("Hello world!")
NameError
Hello world!
"Hello world"
Print(Hello world!)
What will the output be from the following Python code?
print(9/3)
3
3.0
9/3
SyntaxError
What will the output be from the following Python code?
print(Hello world!)
Hello world!
SyntaxError
Hello world
print(Hello world!)
What is the Python built-in function to converts a number to a string?
str()
int()
parseInt()
convert
Which of these is correct Python conditional statement?
IF answer == "Yes":
if answer == "Yes"
if answer == "Yes":
if answer = "yes":
which library we import if we want to draw chart
numpy
matplotlib
pandas
to add a title in the chart we use the function
title("title of the chart")
plt.title("title of the chart")
plt.title(title of the chart)
Which of the codes below should we use to rotate the data ticks on x-axis?
plt.xticks(rotation=30)
plt.ylabel(rotation=30)
plt.yticks(rotation=30)
plt.xlabel(rotation=30)
Which code should we use to display our graphs?
plt.display()
plt.graph()
plt.show()
plt.chart()
pyplot is also a python library.
False
True

This is an example of a ___________.
Scatter Chart
Line Graph
Bar Graph
Pie Chart
We can use matplotlib without installing the library.
True
False
The maximum number that you can assign for the color is ____.
4
3
2
1
Python language was developed in what year?
1985
2001
1991
1820
Is python an interpreter or compiler programming language?
Compiler
Interpreter
Python is uses braces to block off code
True
False
Python uses indentation to block code into chunks
True
False
Python correct naming convention for constants is?
firstName
First_Name
FIRST_NAME
firstname
Python correct naming convention for variables is?
new_user25
NewUser25
25_new_user
25NewUser
NEWUSER25

What output will the console show, if 15 and 30 are entered by the user?
Syntax error
The sum of the two numbers - 45
The concatenation of the two numbers - 1530
Complier error

What result will display in the shell if 15 and 20 is entered by the user?
"num1 + num2"
1520
35

What datatype will the answer be if the user enters 15 and 30?
Integer
String
Boolean
Float

Which one will display when this code is run?


What does these 4 colour boxes on extreme right side called
Title
Legend
Heading
Label
Plot can be saved in a pdf form
True
False
Matplotlib is a python interface.
True
False
The most popular data visualization library in python is _______.
pip
matinfolib
matplotlib
matpiplib
Markers are data points in the graph?
True
False
______________________ are drawn with respect to the histogram created?
bar plot
Frequency polygon
box plot
none
___________plot is also described as five-number summery plot.
Histogram
box plot
frequency polygon
scatter plot
Which of the following methods should be employed in the code to display a plot?
Display()
Show()
Execute()
Plot()
Which Python Package is used for 2D graphics?
matplotlib.pyplot
matplotlib.pip
matplotlib.numpy
matplotlib.plt
________________function is used to create a horizontal bar chart.
barchart()
barh()
bar()
None of the above
In computer science, information and facts observed and collected are known as _______________ .
Desktop
Computer
Data
Hard Disk
The process of data representation through plots and graphs is called ____________.
Data Science
Data Visualization
Data
Drawing

This is an example of a ________________ plot.
Column
Area
Scatter
Line

Choose the correct option
plt.xlabel("Tree Growth")
plt.ylabel("Tree Growth")
plt.color("Tree Growth")
plt.title("Tree Growth")

Choose the correct option.
plt.xlabel("Year")
plt.ylabel("Year")
plt.title("Year")
plt.DataFrame("Year")

Choose the correct option.
plt.title("Feet")
plt.ylabel("Feet")
plt.xlabel("Feet")
plt.Data("Feet")
It is better to use line plots when the data is related to time, like growth over years.
True
False
__________________ function is used to create line plot in python.
plot()
line()
scatter()
dataframe()
__________________ function is used to create Scatter plot in python.
plot()
line()
scatter()
dataframe()
The bigger the data collection the better understanding of Data.
True
False

This is an example of a ________________ plot.
Column
Area
Scatter
Line
The process of studying data is called ________________
Data Analysis
Data Collection
Data Visualization
The library that used to create graphs or plots in Python is_____________
DataFrame
Pandas
Matplotlib
What is Data Visualization?
is what allows your phone to get online when you're away from Wi-Fi.
is the graphical representation of information and data.
What is line plot?
type of plot or mathematical diagram using Cartesian coordinates to display values for typically two variables for a set of data.
type of chart which displays information as a series of data points called 'markers' connected by straight line segments.
Scatter plot is: type of plot or mathematical diagram using Cartesian coordinates to display values for typically two variables for a set of data.
False
True
There are how many types of line graphs?
4 types
6 types
3 types
Full form of API
Application Process Interchange
Application Programs Interchange
Application Process Interface
Application Programming Interface
Connector Library to connect MySQL with Python IDLE is
pymysql
mysql.connector
both a and b
none of these
import mysql.connector as mys
mydb = mys.connect( host="localhost", user="root",
password="root"
)
mycursor = mydb.cursor()
mycursor.execute("CREATE DATABASE KVSEC3")
AFTER EXECUTING THE ABOVE CODE. What will be done
(a)
To display all the databases of MySQL with the help of cursor mycursor , command will be
mycursor.execute("SHOW DATABASES")
mycursor.execute("DESC DATABASES")
mycursor.executes("SHOW DATABASES")
mycursor.execute("SHOW ALL DATABASES")
Correct the error if any
mycursor = mydb.cursor()
mycursor.execute("CREATE TABLE customers (name VARCHAR(25), 'address' VARCHAR(55))")
mycursor.execute('CREATE TABLE customers (name VARCHAR(25), 'address' VARCHAR(55))')
mycursor.execute("CREATE TABLE customers (name VARCHAR(25), address VARCHAR(55))')
mycursor.execute("CREATE TABLE customers (name VARCHAR(25), address VARCHAR(55));")
mycursor.execute("CREATE TABLE customers (name VARCHAR(25), address VARCHAR55))")
After inserting the data we need to issue
rollback
set autocommit
mycur.commit(1)
mycur.commit()
To close a connection (CON) we Use
(a)
What does CSV stand for?
Cursor Separated Variables
Comma Separated Values
Cursor Separated Values
Cursor Separated Version
Which module is used for working with CSV files in Python?
random
statistics
csv
math
Pandas deals with following data structures
Series
Series and Data Frames
Series, DataFrames and Panel
None of Above
Best way to import the pandas module in your program ?
1.import pandas
2.import pandas as pd
3.from pandas import *
4.All of the above
DataFrame in pandas is
1. dimensional array
2. dimensional array
3.dimensional array
4.None of the above
All pandas data structures are ___ mutable but not always _______mutable.
a) size, value
b) semantic, size
c) value, size
d) none of the mentioned
Which of the following object you get after reading CSV file?
a) DataFrame
b) Character Vector
c) Panel
d) All of the mentioned
Which of the following library is similar to Pandas?
a) NumPy
b) RPy
c) SciPy
d) None of the mentioned
Which is not a feature of series
Homogeneous data
Immutable size
Mutable data
Multiple rows
Series can be created from
Array
Dictionary
Scaler value
All of them
Full form of CSV file is
Comma Separated Vault
Comma Separated Value
Common Separated Value
Common System Value
Not a function of Dataframe
Head()
Tail()
loc()
multi()
Dataframe can contain multiple series
True
False
Which function from the options given below can read the dataset from a large text file?
read_json
read_pickle
read_hdf
read_csv
Which of the following can be used to make a Dataframe?
Series
DataFrame
Structured ndarray
All of the above
Which is the correct Pandas syntax to read in a csv file and assign it to a DataFrame df?
df = read_csv('file.csv')
df = read('file.csv', type = 'csv')
df = pd.read_csv('file.csv')
df = with open('file.csv') as pd.DataFrame
Type the syntax that returns the top 5 rows in DataFrame df with the native Pandas function (not slicing):
(a)
Among the following functions, which one can be used to combine dataframes when they have similar structure.
combine_first
concat()
merge()
For the concat(), if the axis=1, it will join the dataframes ...............
vertically
horizontally
Which function can be used to combine dataframes based on common fields?
merge()
combine_first()
concat()
Which function views dataframe in the form of vertical subset ie column wise?
iterrows()
iteritems()
Which of the functions can be used to delete column/row from a DataFrame?
pop()
at()
drop()
iloc()

