
NEW
Font size
S
M
L
XL
 Worksheets
Graphing
Total questions: 10
Worksheet time: 8mins
Name
Class
Date
1.

What type of graph is this?
a)
Bar Graph
b)
Line Plot
c)
Pictograph
d)
Tally Chart
2.

Which of the following best describes
the motion of the squirrel between 5 s
and 8 s?
a)
The squirrel's speed increased.
b)
The squirrel's speed decreased.
c)
The squirrel's speed did not change.
d)
The squirrel moved backward.
3.

What is the relationship between the independent variable and the dependent variable?
a)
As time increase, distance decreases
b)
As time increases, distance increases
c)
As time decreases, distance decreases
d)
As time decreases, distance increases
4.
If you are graphing data about the temperature at different depths of the ocean, what type of graph would you use?
a)
line
b)
bar
c)
pie
d)
scatter plot
5.
If you are graphing the number of people who are vaccinated vs how many aren't, what type of graph would you use?
a)
bar
b)
line
c)
scatter plot
d)
double line
6.

What is wrong with the graph?
a)
Missing axis label
b)
Should be a line graph
c)
Numbers are not in equal increments
d)
x and y axis need to be switched
7.
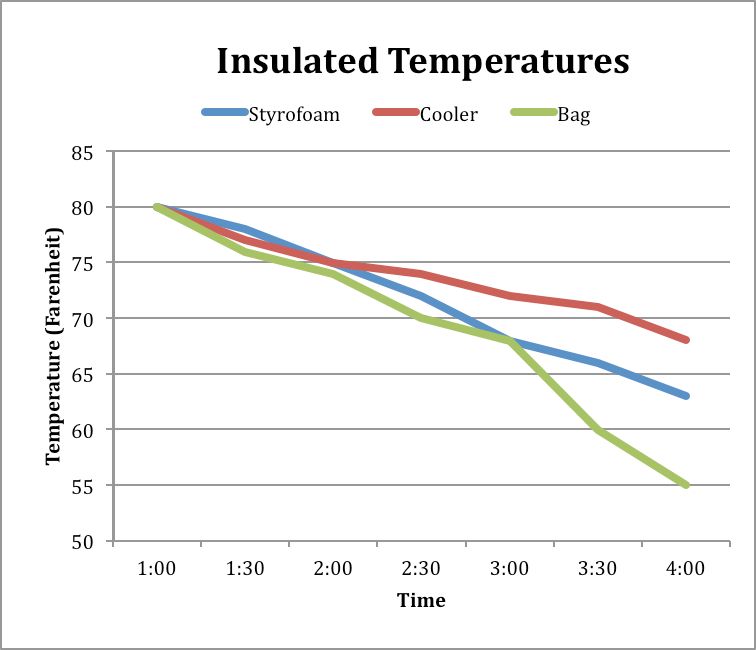
What data does this graph represent?
a)
Change in temperature of a liquid over time in 3 different containers
b)
How temperature can change the molecules in a material
c)
The phase changes of a material
d)
What type of container people use the most to store hot liquids.
8.

The overall trend in the data would be best described as
a)
increasing
b)
decreasing
c)
unchanging
d)
unrelated
9.

On the coordinate plane, which line is the x-axis?
a)
Horizontal Line (Side to Side)
b)
Vertical Line (Up and Down)
10.

On the coordinate plane, which line is the y-axis?
a)
Horizontal Line (Side to Side)
b)
Vertical Line (Up and Down)
Reset

